Download
1 / 1
10 likes | 179 Views
X. X. refrigerator. celery. ant. 7s. 3s. time. Preprocessed fMRI data time x voxels. Construct mean Percent Signal Change (PSC) matrix per stimulus event averaged over 4 successive images. Mean PSC matrix words x voxels. Partition data into training and test sets.

E N D
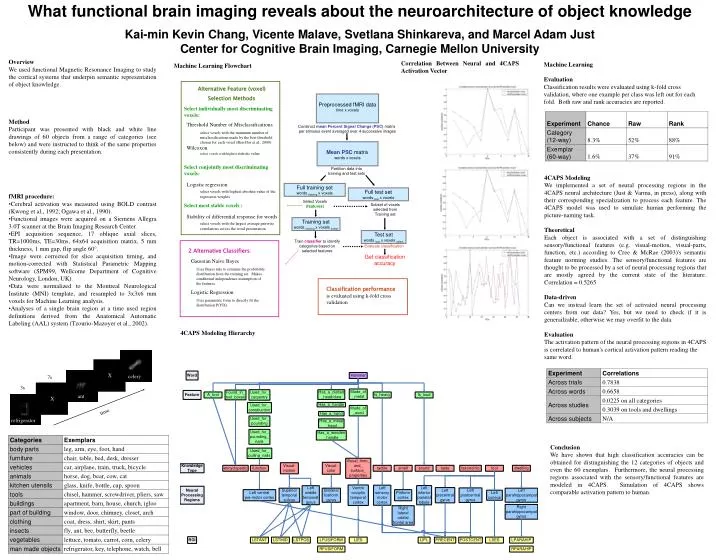
X X refrigerator celery ant 7s 3s time Preprocessed fMRI data time x voxels Construct mean Percent Signal Change (PSC) matrix per stimulus event averaged over 4 successive images Mean PSC matrix words x voxels Partition data into training and test sets Full training set words training x voxels Full test set words test x voxels Select Voxels (features) Subset of voxels selected from Training set Training set words training x voxels select Test set words test x voxels select Train classifierto identify categories based on selected features Evaluate classification Get classification accuracy • Overview • We used functional Magnetic Resonance Imaging to study the cortical systems that underpin semantic representation of object knowledge. • Method • Participant was presented with black and white line drawings of 60 objects from a range of categories (see below) and were instructed to think of the same properties consistently during each presentation. • fMRI procedure: • Cerebral activation was measured using BOLD contrast (Kwong et al., 1992; Ogawa et al., 1990). • Functional images were acquired on a Siemens Allegra 3.0T scanner at the Brain Imaging Research Center. • EPI acquisition sequence, 17 oblique axial slices, TR=1000ms, TE=30ms, 64x64 acquisition matrix, 5 mm thickness, 1 mm gap, flip angle 60°. • Image were corrected for slice acquisition timing, and motion-corrected with Statistical Parametric Mapping software (SPM99, Wellcome Department of Cognitive Neurology, London, UK). • Data were normalized to the Montreal Neurological Institute (MNI) template, and resampled to 3x3x6 mm voxels for Machine Learning analysis. • Analyses of a single brain region at a time used region definitions derived from the Anatomical Automatic Labeling (AAL) system (Tzourio-Mazoyer et al., 2002). Correlation Between Neural and 4CAPS Activation Vector Machine Learning Evaluation Classification results were evaluated using k-fold cross validation, where one example per class was left out for each fold. Both raw and rank accuracies are reported. Machine Learning Flowchart • Alternative Feature (voxel) • Selection Methods • Select individually most discriminating voxels: • Threshold Number of Misclassifications • select voxels with the minimum number of misclassifications made by the best threshold chosen for each voxel (Ben-Dor et al., 2000) • Wilcoxon • select voxels with highest statistic value • Select conjointly most discriminating voxels: • Logistic regression • select voxels with highest absolute value of the regression weights • Select most stable voxels : • Stability of differential response for words • select voxels with the largest average pairwise correlations across the word presentation What functional brain imaging reveals about the neuroarchitecture of object knowledgeKai-min Kevin Chang, Vicente Malave, Svetlana Shinkareva, and Marcel Adam JustCenter for Cognitive Brain Imaging, Carnegie Mellon University 4CAPS Modeling We implemented a set of neural processing regions in the 4CAPS neural architecture (Just & Varma, in press), along with their corresponding specialization to process each feature. The 4CAPS model was used to simulate human performing the picture-naming task. Theoretical Each object is associated with a set of distinguishing sensory/functional features (e.g. visual-motion, visual-parts, function, etc.) according to Cree & McRae (2003)'s semantic feature norming studies. The sensory/functional features are thought to be processed by a set of neural processing regions that are mostly agreed by the current state of the literature. Correlation = 0.5265 Data-driven Can we instead learn the set of activated neural processing centers from our data? Yes, but we need to check if it is generailzable, otherwise we may overfit to the data. Evaluation The activation pattern of the neural processing regions in 4CAPS is correlated to human's cortical activation pattern reading the same word. • 2 Alternative Classifiers: • Gaussian Naïve Bayes • Uses Bayes rule to estimate the probability distribution from the training set. Makes conditional independence assumption of the features. • Logistic Regression • Uses parametric form to directly fit the distribution P(Y|X). Classification performance is evaluated using k-fold cross validation 4CAPS Modeling Hierarchy Conclusion We have shown that high classification accuracies can be obtained for distinguishing the 12 categories of objects and even the 60 exemplars. Furthermore, the neural processing regions associated with the sensory/functional features are modeled in 4CAPS. Simulation of 4CAPS shows comparable activation pattern to human.