Download
1 / 23
250 likes | 427 Views
Automatic Blood Pressure Monitor Calibration. Ross Hamilton Lei Qu Hanniff Mohd Nor David Lee. Introduction. Dr. Andre Churchwell is our Sponsor Learned about the vagaries of commercial common blood pressure monitors

E N D
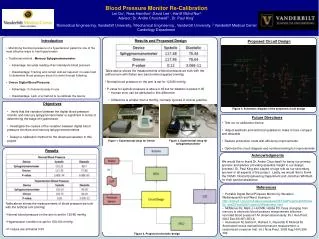
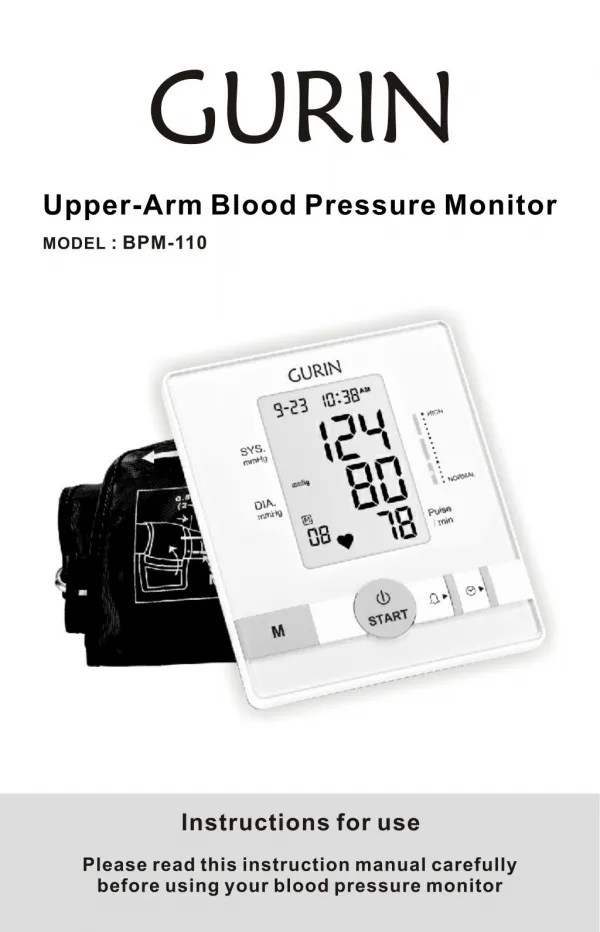
Automatic Blood Pressure Monitor Calibration Ross Hamilton Lei Qu Hanniff Mohd Nor David Lee
Introduction • Dr. Andre Churchwell is our Sponsor • Learned about the vagaries of commercial common blood pressure monitors • Automatic monitors lost their accuracy over extended periods of time because of a lack of calibration • Results in a repurchase of the monitor after a certain period of time and uses
Goals • Investigate the possible variation from automatic blood pressure monitor that will cause diagnosis problems • Solve the problem of recalibration • Design a “rezeroing” device such as a calibration signal circuit to enhance the accuracy of the monitors
Conclusions from the literature • Many other literature also indicate a discrepancies between the mean measurements of the BP monitors versus the mercury sphymanometer (ranging from 0.1 to 2.5 mm Hg) • Thus, we can sufficiently conclude that there is a discrepancy between the two measuring devices. • However, to further complement our experiment, we have performed the similar statistic comparison ourselves
Cause of the discrepancy • Degree of deflation of the arm band • Affect monitors true zero value • Degradation of piezoelectric resistor after usages
Mechanism behind the BP monitor Piezoelectric resistor As the arm band inflates, it shuts off the blood flow in the valves of the patient’s arm As the arm band deflates, the blood flow will restart, thus there will be pressure from blood flow to the arm band Beginning stage of blood flow is turbulence flow, and as arm band releases, flow becomes more laminar
Mechanism Continued • Pressure goes to piezoelectric resistor which will act as a transducer and give a signal readout • Systolic pressure will be obtained at the highest variance of the pulse wave peaks • the diastolic pressure will be the lowest variance of the pulse wave peaks
The Gold Standard • Mercury sphymanometer • Uses no electronic transducers • Mercury is extremely pressure-sensitive • From Watson, et al, the accuracy of the mercury sphymanometer is confirmed.
Progress thus far • The fake arm experiment between the gold standard and the BP monitor • Bandpass filter on the breadboard (picture included)
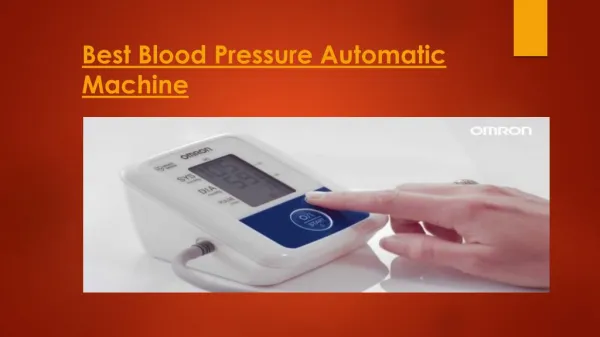
The fake arm experiment • Null hypothesis: the mean of the Omron values are equal to the mean from the sphymanometer • Assumptions • The data are obtained from the identical sample population (generated fr4om the same BP analyzer) • The gold standard does not have drifting issues • Used the fake arm blood pressure analyzer to generate the BP • 20 trials • The paired two-tail t-test was conducted to determine the validity of the null hypothesis • P value = 6.19 x 10^-15 • Null hypothesis rejected • Hypertension case also experimented with a set average BP (150/100) • P value = 1.15 x 10^-15 • Null hypothesis rejected
Conclusion • The mean of the Omron values are not equal to the mean of the sphymanometer • We can infer from this conclusion that variation resulted from the Omron • However, the trials are only 20 so this conclusion is statistically insufficient
Constructing the circuit • Started constructing the bandpass filter • The resisters and capacitors will be modified through trial and error to get a desired filtration of the analog input • The circuitry was modified with the help of Dr. Galloway • The analog input will have frequency simulating the actual heart beat (ranging between 1 and 2 Hz) with a signal intensity of 5 volts • The signal will be captured using Labview with a sample rate of 1000 Hz for resolution purposes
Problems faced • The ADC element pins are separately too closely for insertion unto the breadboard • MCU programming may be complex • Running out of time so must dedicate more hours
Future work • Add a pressure transducer to the input port • Adapt the ADC unto an artificial chip and connect it to the filter circuit • Connect the port to the pressurizing pad • Construct the MCU unit • Connect the compartments • Perform another experiment between the gold standard and the BP monitor with greater number of trials (~300 trials)
References • Discrepancies references • de Greeff A, Shennan A. Blood pressure measuring devices: ubiquitous, essential but imprecise. Expert Rev Med Devices. 2008 Sep;5(5):573-9. Review • Ellis C, Gamble G, Hamer A, Williams M, Matsis P, Elliott J, Devlin G, Richards M, White H; New Zealand Acute Coronary Syndromes (NZACS) Audit Group. Patients admitted with an acute coronary syndrome (ACS) in New Zealand in 2007: results of a second comprehensive nationwide audit and a comparison with the first audit from 2002. • Heinemann M, Sellick K, Rickard C, Reynolds P, McGrail M. Automated versus manual blood pressure measurement: a randomized crossover trial. Int J NursPract. 2008 Aug;14(4):296-302. • Lamb TS, Thakrar A, Ghosh M, Wilson MP, Wilson TW. Comparison of two oscillometric blood pressure monitors in subjects with atrial fibrillation. Clin Invest Med. 2010 Feb 1;33(1):E54-62. • Landgraf J, Wishner SH, Kloner RA. Comparison of automated oscillometric versus auscultatory blood pressure measurement. Am J Cardiol. 2010 Aug 1;106(3):386-8. Epub 2010 May 22. PubMed PMID: 20643251. [ • McManus RJ, Mant J, Hull MR, Hobbs FD. Does changing from mercury to electronic blood pressure measurement influence recorded blood pressure? An observational study. Br J Gen Pract. 2003 Dec;53(497):953-6. • Misc. resources • http://instruct1.cit.cornell.edu/courses/ee476/FinalProjects/s2005/ww56_ws62/Final%20Project%20Web/index.html • http://www.ncbi.nlm.nih.gov/pmc/articles/PMC1120346/ • Watson, S.; Wenzel, R. R.; diMatteo, C.; Meier, B.; and Lüscher, T. F. (1998). "Accuracy of a new wrist cuff oscillometric blood pressure device". American Journal of Hypertension 11: 1469-1474 (1998).