Download
1 / 36
360 likes | 463 Views
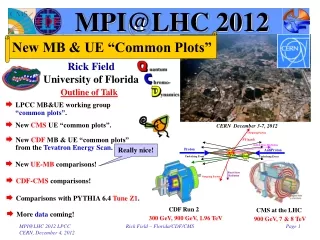
MPI@TAU 2012. Energy Dependence of the UE. Rick Field University of Florida. Tel Aviv University October 14-18, 2012. Outline of Talk. CDF PYTHIA 6.2 Tevatron Tune DW. CMS PYTHIA 6.4 LHC Tune Z1. LPCC MB&UE working group “common plots”.

E N D
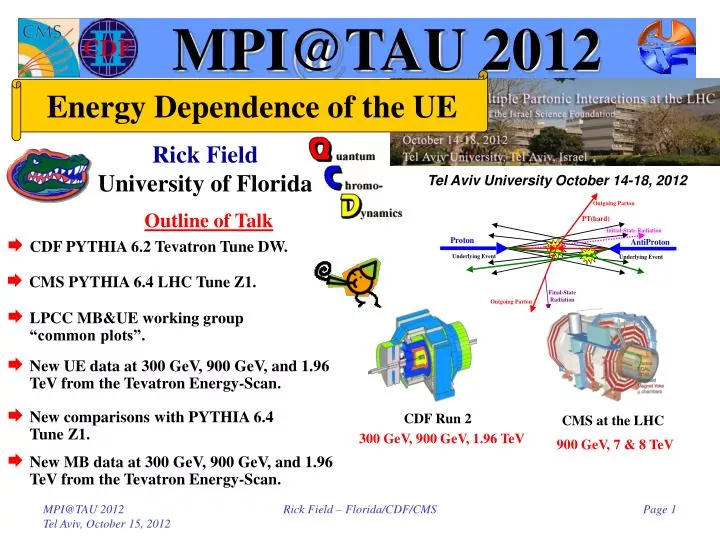
MPI@TAU 2012 Energy Dependence of the UE Rick Field University of Florida Tel Aviv University October 14-18, 2012 Outline of Talk • CDF PYTHIA 6.2 Tevatron Tune DW. • CMS PYTHIA 6.4 LHC Tune Z1. • LPCC MB&UE working group “common plots”. • New UE data at 300 GeV, 900 GeV, and 1.96 TeV from the Tevatron Energy-Scan. • New comparisons with PYTHIA 6.4 Tune Z1. CDF Run 2 CMS at the LHC 300 GeV, 900 GeV, 1.96 TeV 900 GeV, 7 & 8 TeV • New MB data at 300 GeV, 900 GeV, and 1.96 TeV from the Tevatron Energy-Scan. Rick Field – Florida/CDF/CMS
Traditional Approach CDF Run 1 Analysis • Look at charged particle correlations in the azimuthal angle Df relative to a leading object (i.e. CaloJet#1, ChgJet#1, PTmax, Z-boson). For CDF PTmin = 0.5 GeV/c hcut = 1. Charged Particle Df Correlations PT > PTmin |h| < hcut Leading Calorimeter Jet or Leading Charged Particle Jet or Leading Charged Particle or Z-Boson “Transverse” region very sensitive to the “underlying event”! • Define |Df| < 60o as “Toward”, 60o < |Df| < 120o as “Transverse”, and |Df| > 120o as “Away”. • All three regions have the same area in h-f space, Dh×Df = 2hcut×120o = 2hcut×2p/3. Construct densities by dividing by the area in h-f space. Rick Field – Florida/CDF/CMS
“Transverse” Charged Density • Shows the charged particle density in the “transverse” region for charged particles (pT > 0.5 GeV/c, |h| < 1) at 7 TeVas defined by PTmax, PT(chgjet#1), and PT(muon-pair) from PYTHIATune DWat the particle level (i.e. generator level). Charged particle jets are constructed using the Anti-KT algorithm with d = 0.5. Rick Field – Florida/CDF/CMS
Jet Radius Dependence The UE activity is higher for large jet radius! Tune Z1 • The charged particle density in the “transverse” region as defined by the leading charged particle jet from PYTHIA Tune Z1. The charged particles are in the region pT > 0.5 GeV/c and |h| < 2.5. Charged particle jets are constructed using the Anti-KT algorithm with d = 0.2, 0.5, and 1.0 from charged particles in the region pT > 0.5 GeV/c and |h| < 2.5, however, the leading charged particle jet is required to have |h(chgjet#1)| < 1.5. It seems that large jet radius “biases” the UE to be more active! Rick Field – Florida/CDF/CMS
PYTHIA Tune DW CMS ATLAS • ATLAS preliminary data at 900 GeV and 7 TeV on the “transverse” charged particle density, dN/dhdf, as defined by the leading charged particle (PTmax) for charged particles with pT > 0.5 GeV/c and |h| < 2.5. The data are corrected and compared with PYTHIA Tune DW at the generator level. • CMS preliminary data at 900 GeV and 7 TeV on the “transverse” charged particle density, dN/dhdf, as defined by the leading charged particle jet (chgjet#1) for charged particles with pT > 0.5 GeV/c and |h| < 2. The data are uncorrected and compared with PYTHIA Tune DW after detector simulation. Rick Field – Florida/CDF/CMS
PYTHIA Tune DW Ratio CMS CMS • Ratio of CMS preliminary data at 900 GeV and 7 TeV on the “transverse” charged particle density, dN/dhdf, as defined by the leading charged particle jet (chgjet#1) for charged particles with pT > 0.5 GeV/c and |h| < 2. The data are uncorrected and compared with PYTHIA Tune DW after detector simulation. • CMS preliminary data at 900 GeV and 7 TeV on the “transverse” charged particle density, dN/dhdf, as defined by the leading charged particle jet (chgjet#1) for charged particles with pT > 0.5 GeV/c and |h| < 2. The data are uncorrected and compared with PYTHIA Tune DW after detector simulation. Rick Field – Florida/CDF/CMS
PYTHIA Tune Z1 • All my previous tunes (A, DW, DWT, D6, D6T, CW, X1, and X2) were PYTHIA 6.4 tunes using the old Q2-ordered parton showers and the old MPI model (really 6.2 tunes)! PARP(90) PARP(82) Color • I believe that it is time to move to PYTHIA 6.4 (pT-ordered parton showers and new MPI model)! Connections Diffraction • Tune Z1: I started with the parameters of ATLAS Tune AMBT1, but I changed LO* to CTEQ5L and I varied PARP(82) and PARP(90) to get a very good fit of the CMS UE data at 900 GeV and 7 TeV. • The ATLAS Tune AMBT1 was designed to fit the inelastic data for Nchg ≥ 6 and to fit the PTmax UE data with PTmax > 10 GeV/c. Tune AMBT1 is primarily a min-bias tune, while Tune Z1 is a UE tune! UE&MB@CMS Rick Field – Florida/CDF/CMS
PYTHIA Tune Z1 Parameters not shown are the PYTHIA 6.4 defaults! Rick Field – Florida/CDF/CMS
CMS UE Data CMS CMS Tune Z1 Tune Z1 • CMS published data at 900 GeV and 7 TeV on the “transverse” charged PTsum density, dPT/dhdf, as defined by the leading charged particle jet (chgjet#1) for charged particles with pT > 0.5 GeV/c and |h| < 2.0. The data are corrected and compared with PYTHIA Tune Z1 at the generator level. • CMS published data at 900 GeV and 7 TeV on the “transverse” charged particle density, dN/dhdf, as defined by the leading charged particle jet (chgjet#1) for charged particles with pT > 0.5 GeV/c and |h| < 2.0. The data are corrected and compared with PYTHIA Tune Z1 at the generator level. CMS corrected data! CMS corrected data! Very nice agreement! Rick Field – Florida/CDF/CMS
ATLAS UE Data ATLAS ATLAS Tune Z1 Tune Z1 • ATLAS published data at 900 GeV and 7 TeV on the “transverse” charged particle density, dN/dhdf, as defined by the leading charged particle (PTmax) for charged particles with pT > 0.5 GeV/c and |h| < 2.5. The data are corrected and compared with PYTHIA Tune Z1 at the generator level. • ATLAS published data at 900 GeV and 7 TeV on the “transverse” charged PTsum density, dPT/dhdf, as defined by the leading charged particle (PTmax) for charged particles with pT > 0.5 GeV/c and |h| < 2.5. The data are corrected and compared with PYTHIA Tune Z1 at the generrator level. ATLAS publication – arXiv:1012.0791 December 3, 2010 Rick Field – Florida/CDF/CMS
MB&UE Working Group MB & UE Common Plots CMS ATLAS • The LPCC MB&UE Working Group has suggested several MB&UE “Common Plots” the all the LHC groups can produce and compare with each other. Rick Field – Florida/CDF/CMS
CMS Common Plots Note that all the “common plots” require at least one charged particle with pT > 0.5 GeV/c and |h| < 0.8! This done so that the plots are less sensitive to SD and DD. Direct charged particles (including leptons) corrected to the particle level with no corrections for SD or DD. Rick Field – Florida/CDF/CMS
MB Common Plots 7 TeV Direct charged particles (including leptons) corrected to the particle level with no corrections for SD or DD. Rick Field – Florida/CDF/CMS
UE Common Plots Rick Field – Florida/CDF/CMS
New CMS UE Data Less than 4% change! CMS CMS Tune Z1 Tune Z1 • CMS preliminary data at 900 GeV and 7 TeV on the “transverse” charged particle density, dN/dhdf, as defined by the leading charged particle (PTmax) for charged particles with pT > 0.5 GeV/c and |h| < 0.8. The data are corrected and compared with PYTHIA Tune Z1 at the generator level. • CMS preliminary data at 900 GeV and 7 TeV on the “transverse” charged PTsum density, dPT/dhdf, as defined by the leading charged particle (PTmax) for charged particles with pT > 0.5 GeV/c and |h| < 0.8. The data are corrected and compared with PYTHIA Tune Z1 at the generator level. CMS corrected data! CMS corrected data! Very nice agreement! Rick Field – Florida/CDF/CMS
UE Common Plots Rick Field – Florida/CDF/CMS
Tevatron Energy Scan • Just before the shutdown of the Tevatron CDF has collected more than 10M “min-bias” events at several center-of-mass energies! 900 GeV 300 GeV 1.96 TeV 300 GeV 12.1M MB Events 900 GeV 54.3M MB Events Rick Field – Florida/CDF/CMS
New CDF UE Data 1.96 TeV 25,371,145 Events 900 GeV 37,075,521 Events • New Corrected CDF data at 300 GeV, 900 GeV, and 1.96 TeV on the “transverse” charged particle density, dN/dhdf, as defined by the leading charged particle (PTmax) for charged particles with pT > 0.5 GeV/c and |h| < 1.0. 300 GeV 7,233,840 Events Rick Field – Florida/CDF/CMS
New CDF UE Data • New Corrected CDF data at 300 GeV, 900 GeV, and 1.96 TeV on the “transverse” charged PTsum density, dPT/dhdf, as defined by the leading charged particle (PTmax) for charged particles with pT > 0.5 GeV/c and |h| < 1.0. Rick Field – Florida/CDF/CMS
New CDF UE Data • New Corrected CDF data at 300 GeV, 900 GeV, and 1.96 TeV on the “transverse” charged particle average pT, as defined by the leading charged particle (PTmax) for charged particles with pT > 0.5 GeV/c and |h| < 1.0. Rick Field – Florida/CDF/CMS
Energy Dependence • New Corrected CDF data at 300 GeV, 900 GeV, and 1.96 TeV on the “transverse” charged particle density, dN/dhdf, as defined by the leading charged particle (PTmax) for charged particles with pT > 0.5 GeV/c and |h| < 1.0 for 5.0 < PTmax < 6.0 GeV/c. • New Corrected CDF data at 300 GeV, 900 GeV, and 1.96 TeV on the “transverse” charged particle density, dN/dhdf, as defined by the leading charged particle (PTmax) for charged particles with pT > 0.5 GeV/c and |h| < 1.0. Rick Field – Florida/CDF/CMS
Energy Dependence • New Corrected CDF data at 300 GeV, 900 GeV, and 1.96 TeV on the “transverse” charged PTsum density, dPT/dhdf, as defined by the leading charged particle (PTmax) for charged particles with pT > 0.5 GeV/c and |h| < 1.0. • New Corrected CDF data at 300 GeV, 900 GeV, and 1.96 TeV on the “transverse” charged PTsum density, dPT/dhdf, as defined by the leading charged particle (PTmax) for charged particles with pT > 0.5 GeV/c and |h| < 1.0 for 5.0 < PTmax < 6.0 GeV/c. Rick Field – Florida/CDF/CMS
Energy Dependence • New Corrected CDF data at 300 GeV, 900 GeV, and 1.96 TeV on the “transverse” charged particle average pT as defined by the leading charged particle (PTmax) for charged particles with pT > 0.5 GeV/c and |h| < 1.0 for 5.0 < PTmax < 6.0 GeV/c. • New Corrected CDF data at 300 GeV, 900 GeV, and 1.96 TeV on the “transverse” charged particle average pT as defined by the leading charged particle (PTmax) for charged particles with pT > 0.5 GeV/c and |h| < 1.0. Rick Field – Florida/CDF/CMS
Energy Ratio: 1960/300 • Ratio of the CDF data at 300 GeV and 1.96 TeV on the “transverse” charged particle density, dN/dhdf, as defined by the leading charged particle (PTmax) for charged particles with pT > 0.5 GeV/c and |h| < 1.0. Shows 1.96 TeV divided by 300 GeV. • New Corrected CDF data at 300 GeV, 900 GeV, and 1.96 TeV on the “transverse” charged particle density, dN/dhdf, as defined by the leading charged particle (PTmax) for charged particles with pT > 0.5 GeV/c and |h| < 1.0. Rick Field – Florida/CDF/CMS
Energy Ratio: 900/300 • New Corrected CDF data at 300 GeV, 900 GeV, and 1.96 TeV on the “transverse” charged particle density, dN/dhdf, as defined by the leading charged particle (PTmax) for charged particles with pT > 0.5 GeV/c and |h| < 1.0. • Ratio of the CDF data at 300 GeV and 900 GeV on the “transverse” charged particle density, dN/dhdf, as defined by the leading charged particle (PTmax) for charged particles with pT > 0.5 GeV/c and |h| < 1.0. Shows 900 GeV divided by 300 GeV. Rick Field – Florida/CDF/CMS
Energy Ratio: 1960/900 • New Corrected CDF data at 300 GeV, 900 GeV, and 1.96 TeV on the “transverse” charged particle density, dN/dhdf, as defined by the leading charged particle (PTmax) for charged particles with pT > 0.5 GeV/c and |h| < 1.0. • Ratio of the CDF data at 900 GeV and 1.96 TeV on the “transverse” charged particle density, dN/dhdf, as defined by the leading charged particle (PTmax) for charged particles with pT > 0.5 GeV/c and |h| < 1.0. Shows 1.96 TeV divided by 900 GeV. Rick Field – Florida/CDF/CMS
PYTHIA 6.4 Tune Z1 ATLAS CMS CDF CDF ALICE CDF Rick Field – Florida/CDF/CMS
PYTHIA 6.4 Tune Z1 CMS ATLAS CDF CDF ALICE CDF Rick Field – Florida/CDF/CMS
PYTHIA 6.4 Tune Z1 Rick Field – Florida/CDF/CMS
New CDF MB Data CMS CDF CDF CDF • New Corrected CDF data at 300 GeV, 900 GeV, and 1.96 TeV on on pseudo-rapidity distribution of charged particles, dN/dh, with pT > 0.5 GeV/c. Events are required to have at least one charged particle with |h| < 0.8 and pT > 0.5 GeV/c. The data are corrected to the particle level with errors that include both the statistical error and the systematic uncertainty. Rick Field – Florida/CDF/CMS
New CDF MB Data CMS CDF CDF CDF • New Corrected CDF data at 300 GeV, 900 GeV, and 1.96 TeV on on pseudo-rapidity distribution of charged particles, dN/dh, with pT > 1.0 GeV/c. Events are required to have at least one charged particle with |h| < 0.8 and pT > 1.0 GeV/c. The data are corrected to the particle level with errors that include both the statistical error and the systematic uncertainty. Rick Field – Florida/CDF/CMS
Energy Dependence dN/dh • CMS data at 7 TeV and 900 GeV and CDF data at 1.96 TeV, 900 GeV, and 300 GeV on dN/dh at h = 0 with pT > 0.5 GeV/c as a function of the center-of-mass energy. Events are required to have at least one charged particle with |h| < 0.8 and pT > 0.5 GeV/c. The data are corrected to the particle level with errors that include both the statistical error and the systematic uncertainty. Rick Field – Florida/CDF/CMS
Energy Dependence dN/dh • CMS data at 7 TeV and 900 GeV and CDF data at 1.96 TeV, 900 GeV, and 300 GeV on dN/dh at h = 0 with pT > 1.0 GeV/c as a function of the center-of-mass energy. Events are required to have at least one charged particle with |h| < 0.8 and pT > 1.0 GeV/c. The data are corrected to the particle level with errors that include both the statistical error and the systematic uncertainty. Rick Field – Florida/CDF/CMS
MB Common Plots 900 GeV Direct charged particles (including leptons) corrected to the particle level with no corrections for SD or DD. Rick Field – Florida/CDF/CMS
PTmax versus Leading Jet • Published CDF Run 2 data at 1.96 TeV on the “transverse” charged particle density, dN/dhdf, as defined by the leading calorimeter jet (jet#1) for charged particles with pT > 0.5 GeV/c and |h| < 1.0 compared with PYTHIA Tune Z1. • New CDF data 1.96 TeV on the “transverse” charged particle density, dN/dhdf, as defined by the leading charged particle (PTmax) for charged particles with pT > 0.5 GeV/c and |h| < 1.0 compared with PYTHIA Tune Z1. Okay No inconsistency But need to understand! Yikes! ??? Rick Field – Florida/CDF/CMS
More Coming Soon! What we are learning should allow for a deeper understanding of MPI which will result in more precise predictions at the future LHC energy of 13 TeV! • CDF - Many More UE Observables: Nchg density, PTsum density, average pT, “toward”, “away”, “transverse”, “transMAX”, “transMIN”, distributions, etc.. • CDF - Two h Ranges: Must do (pT > 0.5 GeV/c, |h| < 0.8) as well as (pT > 0.5 GeV, |h| < 1). • CDF - Min-Bias: Many MB observables: Multiplicity, dN/dh, pT distribution, <pT> versus Nchg, etc. Soon we will have MB & UE data at 300 GeV, 900 GeV, 1.96 TeV, 7 TeV, and 8 TeV! We can study the energy dependence more precisely than ever before! Rick Field – Florida/CDF/CMS