Download
1 / 27
270 likes | 384 Views
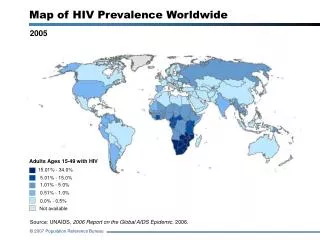
Methods for establishing the extent of HIV epidemics and trends in prevalence Geoff Garnett Imperial College London. UNAIDS methods for developing countries: Models. Earlier model start time and current prevalence fitted to a gamma curve

E N D
Methods for establishing the extent of HIV epidemics and trends in prevalence Geoff Garnett Imperial College London
UNAIDS methods for developing countries: Models • Earlier model start time and current prevalence fitted to a gamma curve • Epidemic Projection Package (EPP) – Generalised epidemic – fits prevalence trends to ANC data (later adjusted for national surveys) • Workbooks – Concentrated & low level epidemics – numbers and prevalence in specific groups • Spectrum – Calculates ages specific incidence and impact on the basis of overall prevalence trends. • Short term incidence model
Measuring epidemiological impact of prevention Risk behaviours Behavioural surveys Primary prevention Surveillance with novel tests / modelling HIV incidence Sentinel surveillance / population based surveys HIV prevalence Secondary prevention Case reports AIDS Tertiary prevention Registration / census / surveys Deaths
Generalised epidemics Concentrated epidemics HIV Prevalence data IDUs, MSM, SWs, clients Size estimates ANC data ANC data minus estimated SWs & IDUs Household based surveys Associated prevalence estimates Upper and lower bounds over time Fitted in EPP to generate trends Workbooks spreadsheet Derived incidence Spectrum – age structured Mortality, orphanhood.
Sources of uncertainty in HIV/AIDS estimates for generalised epidemics Estimate Source Uncertainty Relationship of adult prevalence to prevalence among pregnant women Survival of infected adults National coverage of sentinel surveillance Epidemic curve Adult HIV prevalence, new infections and AIDS mortality Probability of mother to child transmission New infections in children Child AIDS deaths and HIV prevalence Child survival (AIDS and other causes
The natural course of incidence and prevalence of a local HIV epidemic over time Prevalence HIV Rt=R0>1 Rt<1 Rt=1 Incidence HIV infection 25 20 Incidence AIDS deaths 15 Percent Incidence /Prevalence Interested in current incidence – but even if a validated test available would require an order of magnitude increase in sample sizes. 10 5 0 0 10 20 30 40 50 Time (years)
Data – HIV prevalence in ANC clinics in urban and semi-urban Zimbabwe 60 40 50 20 40 Year-on-year change (%) HIV prevalence (%) 30 0 20 -20 10 -40 0 1990 1994 1998 2002 2006 2010 2000 1980 1990 Year Year Median Change Change in specific clinic
Models fitted to urban ANC HIV prevalence trends in Zimbabwe Sample importance resampling (sample 4,000,000 resample 8,000) No behaviour change Bayes Factor 58 Likelihood ratio test p< 0.0001 60 Behaviour change 50 40 HIV prevalence (%) 30 20 10 0 1980 1985 1990 1995 2000 2005 2010 Year
Incidence trends associated with model fits – urban Zimbabwe 10 8 6 HIV incidence (per 100 per year) 4 97.5% Mode 2 2.5% 0 1990 2000 1980 2010 Year
a b c d e f g h
Generalised epidemics Concentrated epidemics HIV Prevalence data IDUs, MSM, SWs, clients Size estimates ANC data ANC data minus estimated SWs & IDUs Household based surveys Associated prevalence estimates Upper and lower bounds over time Fitted in EPP to generate trends Workbooks spreadsheet Derived incidence Spectrum – age structured Mortality, orphanhood.
Adult HIV prevalence Sources of uncertainty in concentrated HIV epidemics Coverage of sentinel surveillance system HIV prevalence among at-risk groups Population size of at-risk groups Survival of infected adults Rates of entering and leaving at-risk groups Adult new infections and AIDS mortality Age and sex distribution of HIV prevalence in at-risk groups Female age-specific fertility rate in at-risk groups New infections in children Impact of HIV on fertility Probability of mother-to-child transmission Child survival (AIDS-related & other causes) Child AIDS deaths & HIV prevalence
Concentrated epidemics - Workbooks • ‘Estimates’ upper and lower bounds for risk group size and for prevalence in risk groups – local expert based. • Calculates a non-overlapping number of infections at a point in time • If multiple time points fits a simple curve (either a single or double logistic curve)
Populations at risk in Europe (need to avoid double counting) At risk Children of +ves Entire population Adult population MSM IDUs Partners of those with risk Sex Workers Immigrants from high prevalence states
Sources of information on the extent of HIV spread Case reports (HIV/AIDS/deaths) Risk behaviour data HIV prevalence surveys General population High risk group Prediction of future HIV trends Estimate of size of high risk group Need consistent sources of information and sampling over time to explore trends
Estimates of size of high risk groups: Prevalence in population based surveys Contact tracing/snowball sampling Counting/mapping Capture/recapture Multiplier Population in HIV prevalence survey needs to match population for which size is estimated MSM in capital city club ≠ men who frequently have sex with men ≠ men who occasionally have sex with men ≠ men who have ever had sex with men
What do we expect the long term prevalence of HIV to be? When can we expect new outbreaks? Stable HIV Prevalence Increased heterogeneity Increasing contacts, transmission likelihood, duration Tipping point R0=1
Referred Routes into healthcare Undiagnosed Never diagnosed Attends ANC Referred Presents at clinic when develops severe symptoms Diagnosed at VCT Diagnosed at VCT Enters Health-care system
New HIV and AIDS diagnoses in the UK, and deaths among HIV infected individuals: 1999 - 2008 (HPA) 9000 HIV diagnoses 8000 AIDS diagnoses 7000 Deaths 6000 Number of HIV and AIDS diagnoses and deaths 5000 4000 3000 2000 1000 0 1999 2000 2001 2002 2003 2004 2005 2006 2007 2008 Year of HIV or AIDS diagnosis or death
Estimated late diagnosis of HIV infection by prevention group, UK: 2007 (HPA) 50% 42% 40% 36% 31% 30% 30% Percentage diagnosed late 19% 20% 10% 0% MSM Heterosexual men Heterosexual Injecting drug Overall users women Total n= 2,679 1,434 2,180 152 7,649 CD4 cell count <200 per mm3 within three months of diagnosis among adults
Scenario III Scenario II Scenario I Figure 1 The BED response function relationship between probability of sample being classified as recent by BED test and time since HIV-infection. The first 2 years (shaded area) is informed by observational data (see text), and the pattern over the remaining time is uncertain and three hypothetical scenarios are constructed.
Proportions of infections of at least one year that are miss-classified by the BED test for six African countries over time (ages 15-49), using BED response scenario B (increasing proportion false positive) Incidence based on spectrum model fits to EPP prevalence trends Uganda Kenya Zambia Nigeria Lesotho Mozabique
Median CD4 count at diagnosis by prevention group: UK (1998-2007) Data on pregnancy status only from 2000
Sources of information on the extent of HIV spread Case reports (HIV/AIDS/deaths) Risk behaviour data HIV prevalence surveys General population High risk group Prediction of future HIV trends Estimate of size of high risk group Variable and diverse data sources can be combined in a modelling framework with consistent relationships between behaviours, incidence, prevalence, CD4 counts, opportunistic infections and death
Sources of information on the extent of HIV spread Screening, testing and care patterns Risk behaviour data Case reports (HIV/AIDS/deaths) With CD4 counts HIV prevalence Models linking epidemiological processes Outputs compared with observation where available