Download
1 / 15
300 likes | 1.18k Views
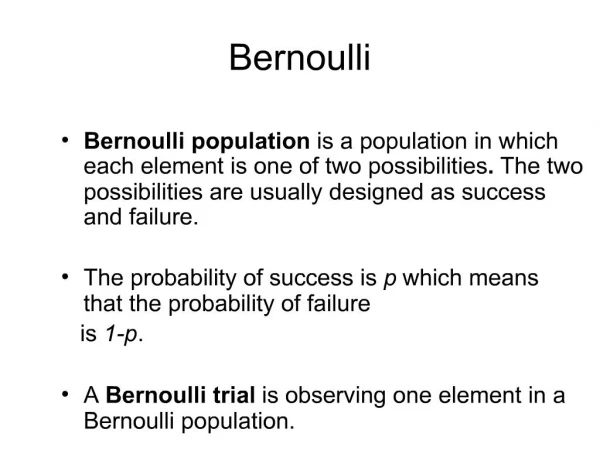
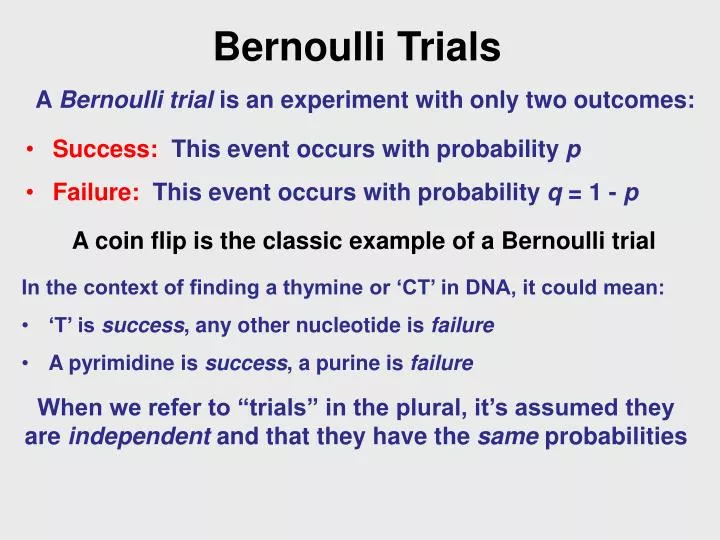
Bernoulli Trials. A Bernoulli trial is an experiment with only two outcomes:. Success: This event occurs with probability p Failure: This event occurs with probability q = 1 - p. A coin flip is the classic example of a Bernoulli trial

E N D
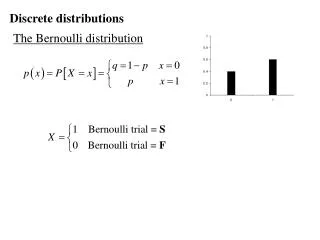
Bernoulli Trials A Bernoulli trial is an experiment with only two outcomes: • Success: This event occurs with probability p • Failure: This event occurs with probability q = 1 - p • A coin flip is the classic example of a Bernoulli trial • In the context of finding a thymine or ‘CT’ in DNA, it could mean: • ‘T’ is success, any other nucleotide is failure • A pyrimidine is success, a purine is failure When we refer to “trials” in the plural, it’s assumed they are independent and that they have the same probabilities
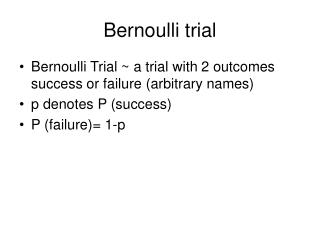
Geometric Distribution The geometric distribution follows immediately from the idea of conducting multiple Bernoulli trials Q: what’s the probability that it takes k trials to get a success?? • Before we can succeed at trial k, we must first have had k-1 failures!! • Each failure occurred with probability q, so there is a term with: • qk-1 • Finally, a single success occurs with probability p, so there is a term: • p1 But each trial is mutually independent, so we can write: Pr{X=k} = qk-1p
Geometric Distribution Geometric distribution for p = 1/5 Image from encyclopedia of math Pr{X=k} = qk-1p What is the probability that the random variable X takes on the value k? X represents the number of trials required to get a success
Binomial Distribution The binomial distribution also arises naturally from the idea of conducting multiple Bernoulli trials Q: what’s the probability that we’ll get k successes in n trials?? • We’re looking for k successes, so there must be a term with: • pk (each success has probability p) • If we’ve had k successes there must be a term reflecting n-k failures: • qn-k (each failure has probability q) • Again trials are mutually independent, so we can write: • qn-kpk BUT WAIT!!! We’re not done!
Binomial Distribution We also need to consider how many different ways we can generate those k successes from n trials. Here we show all the ways you can get 3 T’s in a total of 5 nucleotides (symbol V here is the “non-T” nucleotide ambiguity code – a failure in our Bernoulli trials): ['TTTVV', 'TTVTV', 'TTVVT', 'TVTTV', 'TVTVT', ‘TVVTT', ‘VTTTV', ‘VTTVT', ‘VTVTT', ‘VVTTT'] Does this seem like a familiar problem? It should! n This is just “n choose k”! Therefore we must also have a term: ( ) k
Binomial Distribution Putting it all together: ( ) Pr{X=k} = qn-kpk What is the probability that the random variable X takes on the value k? X represents the number of trials k out of a total of n that were successes n k *One small fly in the ointment.. DNA has four bases, not just two… really we want a multinomial distribution -- a generalization of the binomial distribution. But close enough for government work, eh?
Binomial Distribution Image from zoonek2.free.fr n = 100, p = 0.5 What is the “expected value” of these distributions? Normal curve with same mean and SD drawn over top
Poisson Distribution Another common limiting case of binomial is when we have large N and small p such that the expected (mean) value is a moderate number (between 0 and 5-10). Then the distribution is close to a Poisson distribution Binomial(10,.1) Poisson(1)
Characteristics of Poisson Single parameter (mean): l = Np P( k | l ) = exp(- l) lk/k! Variance = Mean = l ; SD = √l ; For l > 10, Normal approximation N(l, l) is fine l = 3 l = 7
Scientific Computing in Python SciPy ..and more NumPy Matplotlib http://scipy.org
Scientific Computing in Python numPy implements very efficient low-level n-dimensional array processing and other basic numerical routines Our interest in numPy is mostly restricted to the fact that both the sciPy library and matplotlib depend on numPy http://docs.scipy.org/doc/scipy-0.13.0/reference/
Scientific Computing in Python SciPy is the name for the whole ecosystem and a specific scientific computing library! The sciPy library has many numerical algorithms, but also domain specific toolboxes Our interest is primarily in the statistics toolbox http://docs.scipy.org/doc/scipy-0.13.0/reference/
Distributions in scipy.stats SciPy supports both continuous and discrete random variables and associated distributions each distribution in turn supports a number of methods , e.g.: • rvs: Random variates • pdf: Probability Density Function • cdf: Cumulative Distribution Function • sf: Survival Function (1-CDF) • ppf: Percent Point Function (Inverse of CDF) • isf: Inverse Survival Function (Inverse of SF) • stats: Return mean, variance, (Fisher’s) skew, or (Fisher’s) kurtosis • moment: non-central moments of the distribution http://docs.scipy.org/doc/scipy/reference/tutorial/stats.html
Distributions in Python The scipy.stats library supports a rich collection of distributions and their methods. One example: from scipy.stats import binom [ n, p ] = [100,0.5]; myList = [] random_var = binom(n, p) for k in xrange(100): myList.append(random_var.pmf(k)) # .pmf is the “probability mass function” myList here will contain the probabilities associated with the first 100 values of k, and if plotted would recapitulate the earlier binomial distribution histogram http://docs.scipy.org/doc/scipy/reference/stats.html
The matplotlib python library An very powerful tool for professional-quality plots Many usage examples are given in the documentation http://matplotlib.org/