Download
1 / 25
260 likes | 370 Views
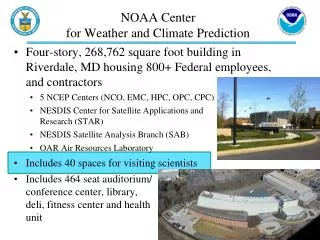
The NOAA Weather and Climate Toolkit . Steve Ansari , Stephen Del Greco, Neal Lott ( NOAA / NCDC). Overview. Free, public domain source code Desktop and command-line application Simple visualization and data export Platform independent (Java-based)

E N D
The NOAA Weather and Climate Toolkit Steve Ansari, Stephen Del Greco, Neal Lott (NOAA / NCDC)
Overview • Free, public domain source code • Desktop and command-line application • Simple visualization and data export • Platform independent (Java-based) • Leverages community tools and standards (NetCDF for Java, Common Data Model, etc…)
Data • Raw data files on disk or remote location (URL, THREDDS, OPeNDAP, etc…) • NetCDF, GRIB, GINI, HDF and more via Unidata Common Data Model (CDM): • Feature types of Grid, Swath, Radial (Time Series, Point, coming soon) • Supports: • NEXRAD, GOES, Model Data, and much more.
New Features New Feature • Math Tool • Time Morphing • GHCN-D export to Shapefile • Isosurface export to KMZ (Google Earth)
Visualization • Simple 2-D maps • Basic overlays included (states, counties, etc…) • Background images from any OGC WMS • Shaded Relief, Topo Maps, Landsat, ext… • Save images and animations to Animated GIF, AVI, KMZ (Google Earth)
Visualization GOES Infrared Water Vapor with Blue Marble Web Map Service (WMS) background map
Visualization Smoothed NEXRAD Reflectivity Data
Visualization U.S. Drought Monitor service from NIDIS/NDMC (National Drought Mitigation Center)
Visualization Sea Surface Temperature (NetCDF data over OPeNDAP)
Visualization • Internal Google Earth Instance: (Currently Windows Only)
Visualization Hurricane Andrew: NCDC GridSat Climate Data Record (CDR).
Visualization New Feature • Math tool (max, min, avg, abs max, sum) (Under ‘More…’ link on ‘Data Selector’ or ‘Grid Properties’)
Visualization New Feature • Time Morphing (Under ‘Tools’ menu) • Interpolation of data between time steps based on storm motion. • Based on Face Morphing algorithms (javamorph) • Storm motion data from NEXRAD Level-III products, RUC model or manual entry. • Many possible future applications.
Visualization New Feature • Time Morphing (Under ‘Tools’ menu) • Example Movies: • Moore, OK 1999: orig. / morph • Fairview, AL 2011: orig. / morph • Surry, VA 2011: orig. / morph • Western NC 2012: orig. / morph • Pierce City, MO 2003: • orig. / morph • GOES Satellite IR:orig. / morph
Data Export • “Bridge” between raw Weather and Climate data and multiple scientific user communities • Export Data to: Shapefile, Well-Known Text, Arc/Info ASCII GRID, Gridded and Raw NetCDF, GeoTIFF and KMZ (Google Earth)
Data Export New Feature • Tool to export NCDC GHCN-D dataset (Global Historical Climatology Network - Daily) from NCDC Climate Data Online to Shapefile.
Applications GOES Satellite Imagery from Hurricane Rita landfall, exported as ASCII GRID, in ArcGIS
Applications GOES Satellite Imagery from Hurricane Rita landfall in Google Earth
Applications • 3D Radar Sweeps in Google Earth: • Drapes rendered image on COLLADA model (Similar to 3D building models)
Applications New Feature • 3D Isosurfaces in Google Earth: • Output of 3D Polygons to KMZ • Supported for Generic Radial, Level-II NEXRAD and Gridded x, y, z datasets. Play Movie
Applications Command-line batch processing of data export
Applications Public domain / open source API
Future Work • Improved Point and Time Series (station data) support. • Comparison between station data and grid/radial data. • More COLLADA work? Cross-sections? • Enhance Time Morphing features. • Batch / Command-line KMZ export. • Enhanced integration with the Climate Services portal (http://www.climate.gov).
Contact Thank you! Questions? WCT Website: http://www.ncdc.noaa.gov/oa/wct Contact: Steve.Ansari@noaa.gov (828) 271-4611 151 Patton Ave. Asheville, NC 28801