Download
1 / 15
150 likes | 330 Views
Statistics for Tankers in Paris & Tokyo MOUs vs B/C – All ships. Period 2003 – 2004 - 2005. Year 2003 (Tankers) Inspections 2362 With Deficiencies 971 (41.11%) Detentions 110 (4.66%). Year 2003 ( All ships) Inspections 20309 With deficiencies 11169 (55%) Detentions 1431 (7.05%).

E N D
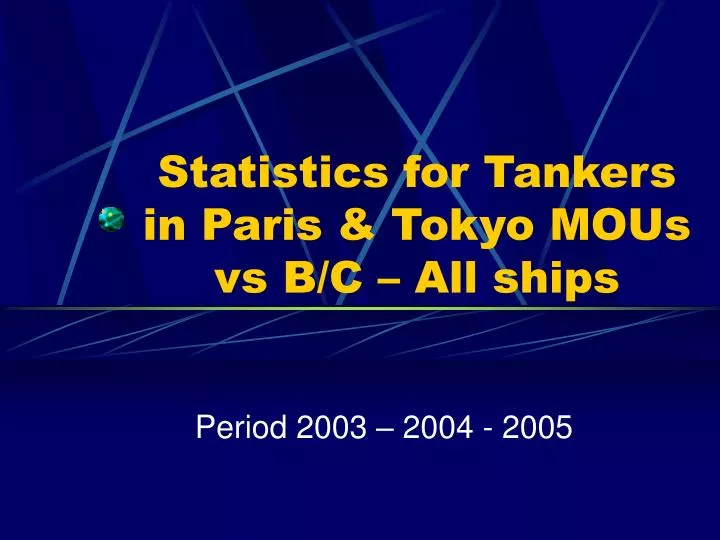
Statistics for Tankers in Paris & Tokyo MOUsvs B/C – All ships Period 2003 – 2004 - 2005
Year 2003 (Tankers) Inspections 2362 With Deficiencies 971 (41.11%) Detentions 110 (4.66%) Year 2003 (All ships) Inspections 20309 With deficiencies 11169 (55%) Detentions 1431 (7.05%) Statistics for Tankers in Paris MOU
Year 2003 (Tankers) Inspections 2362 With Deficiencies 971 (41.11%) Detentions 110 (4.66%) Year 2003 (B/C) Inspections 3507 With deficiencies 2110 (60.17%) Detentions 227 (6.47%) Statistics for Tankers in Paris MOU
Year 2004 (Tankers) Inspections 2060 With Deficiencies 793 (38.50%) Detentions 51 (2.48%) Year 2004 (All ships) Inspections 20316 With deficiencies 10887 (53.59%) Detentions 1187 (5.84%) Statistics for Tankers in Paris MOU
Year 2004 (Tankers) Inspections 2060 With Deficiencies 793 (38.50%) Detentions 51 (2.48%) Year 2004 (B/C) Inspections 3429 With deficiencies 1984 (57.86%) Detentions 206 (6.01%) Statistics for Tankers in Paris MOU
Year 2005 (Tankers) Inspections 1789 With Deficiencies 685 (38.29%) Detentions 43 (2.40%) Year 2005 (B/C) Inspections 3486 With deficiencies 1931 (55.39%) Detentions 150 (4.30%) Statistics for Tankers in Paris MOU
Year 2005 (Tankers) Inspections 1789 With Deficiencies 685(38.28%) Detentions 43 (2.40%) Year 2005 (All ships) Inspections 21026 With deficiencies 10850 (51.60%) Detentions 1043 (4.96%) Statistics for Tankers in Paris MOU
Statistics for Tankers in Paris MOU Detention rates 2003 20042005 % Tankers 4.66% 2.48% 2.40% 3,18 B/C 6.47% 6.01% 4,30% 5,60
Statistics for Tankers in Paris MOU – Flags InspectionsDetentions% Bahamas 158 7 4.43 Greece 175 7 4.00 Comoros 11 3 27.27 Cambodia 7 2 28.57 Honduras 6 2 33.33 Spain 2 1 50.00 Romania 1 1 100.00
Statistics for Tankers in Paris MOU Most common deficiencies • Tankers • Fire safety measures • Structural safety • Life Saving Appliances • Propulsion % Auxiliary
Statistics for B/C in Paris MOU Most common deficiencies • B/C • Fire safety measures • Structural safety • Life Saving Appliances • Safety of navigation Almost the same
ERIKA III New profile for ships not only for B/C – Tankers – Passenger – Ro/Ro – Chemical Tankers • High Risk Ships 6 months Time window 1 month • Medium Risk 12 months ΄΄ 5 months • Low Risk ships 24 months 36 months
ERIKA III / Ship’s Profile • Type • Age • R.O. • Flag including SAF or IMO Audit Scheme • Company • Generic / History performance