Download
1 / 18
180 likes | 287 Views
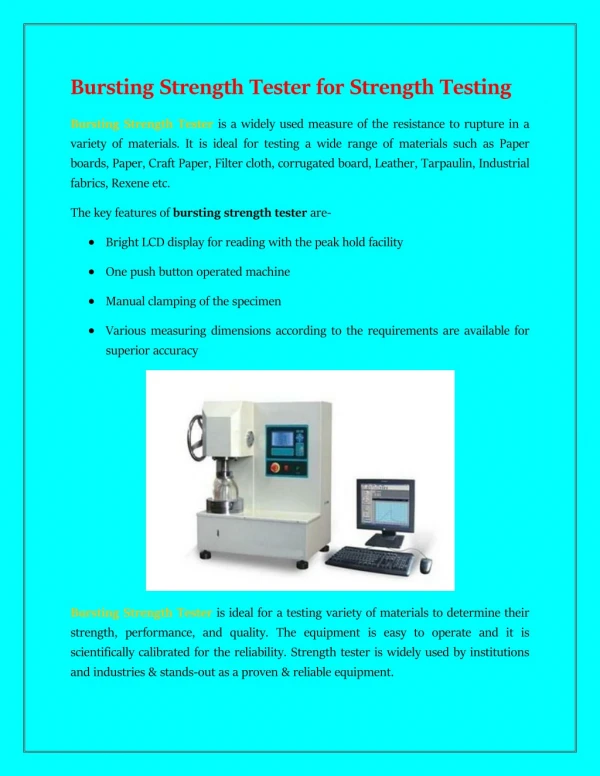
Fiscal Strength. Finding the balance at UMass Boston. Fiscal Strength. operating margin 2.5% actual FY12 2 % target. financial c ushion 28.2% actual FY12 >20% target. e ndowment/FTE $4,711 actual FY12 $7,669 UMass avg. d ebt ratio 5 % actual FY12 8% threshold.

E N D
Fiscal Strength Finding the balance at UMass Boston
Fiscal Strength operating margin 2.5% actual FY12 2% target financial cushion 28.2% actual FY12 >20% target endowment/FTE $4,711 actual FY12 $7,669 UMass avg debt ratio 5% actual FY12 8% threshold return on net assets 8.2% actual FY12 5% target
Fiscal Strength • Start with Income Before Other Revenues, Expenses, Gains & losses • Subtract the value of the Build America Bond subsidy • Subtract the amount of interest expense that was capitalized • Add back depreciation • Subtract the amount of principal payments made • Subtract transfers to Quasi Endowment (which will move up to Restricted Expendable net assets) • Subtract transfers to Plant in support of the Master Plan operating margin 2.5% actual FY12 2% target financial cushion 28.2% actual FY12 >20% target …operating margin should exclude market value adjustments for investments endowment/FTE $4,711 actual FY12 $7,669 UMass avg …we should be using interest expense not interest paid and we should consider … a revised calculation which adds in principal payments to the expenses and takes out depreciation debt ratio 5% actual FY12 8% threshold return on net assets 8.2% actual FY12 5% target
Fiscal Strength Revenue diversity EnrollmentStudent fees State support Grants (federal, state) Other (private, ESS, auxiliaries) Financial management Expenditure control Reporting Multi-year planningAnalysis Asset base Physical infrastructure Deferred maintenance IT infrastructure Financial flexibility Endowment (investments) Reserves (net assets) Debt
Fiscal Strength Expenditure control Reporting Multi-year planning Analysis EnrollmentStudent fees State support Grants (federal, state) Other (ESS, Auxiliaries) EndowmentInvestments Reserves Debt Physical infrastructure Deferred maintenance IT infrastructure
Revenue diversitybreadth of unique revenue streams • Enrollment Federal support • • volatility • federal financial aid • • in- or out-of-state • federal grants • • undergraduate, graduate, PhD • Student fees Private fund-raising • • tuition policy • capital campaign(s) • • mandatory fees • gifts • • differential fees • endowment • • waiver policies • • public/BoT/legislative interest • State support Other • • annual appropriation • auxiliary services • • state financial aid • ESS • • state ISAs, contracts, grants
Asset baseinvestment in physical assets • Physical infrastructure (size, composition, quality) • • sqft inventory • • how is space used (classrooms, conference rooms) • • quality of spaces (expectations, stds or peers) • Deferred maintenance • • current conditions • • mechanical systems vs fluff & buff (painting, carpet) • • proactive vs reactive • IT infrastructure • • changing technology • • UITS
Financial flexibilityability to respond to external events • Endowment (investments) Governance • • local • external (Presidents Office, State) • • quasi • • permanent • Reserves • • current level • • comparison to peers • Debt • • current level, expected growth • • financing (availability, cost)
Expense managementdemonstrate effective cost management & long-term planning • Expenditure control Analysis • • actual to budget results • depth of understanding • • growth trends • evidence informs plans • • comparison to peers • linked to outcomes • • inform actions • Reporting • • integrity of data • • systems that support customers • • mgmt reporting that informs decision • Multi-year reporting • • capital plan • breadth of understanding • • enrollment planning • decision horizon • • integrity of modeling
Fiscal Strength Expenditure control Reporting Multi-year planning Analysis EnrollmentStudent fees State support Grants (federal, state) Other (ESS, Auxiliaries) EndowmentInvestments Reserves Debt Physical infrastructure Deferred maintenance IT infrastructure
Fiscal Strength Expenditure control Reporting Multi-year planning Analysis EnrollmentStudent fees State support Grants (federal, state) Other (ESS, Auxiliaries) Investments Reserves Debt Physical infrastructure Deferred maintenance IT infrastructure
Planning for FY14 Expenditure control fund consolidation changes to budget process Reporting personnel vs operating vacancy factor expanded mgmt reporting more education, training options Multi-year planning greater involvement make it meaningful Analysis expanded partnerships btw academic & support areas issue & policy papers
Fiscal Strength Revenue diversity EnrollmentStudent fees State support Grants (federal, state) Other (private, ESS, auxiliaries) Financial management Expenditure control Reporting Multi-year planningAnalysis Asset base Physical infrastructure Deferred maintenance IT infrastructure Financial flexibility Endowment Reserves Debt