Download
1 / 1
10 likes | 102 Views
An Optimal Learning Approach to Finding an Outbreak of a Disease Warren Scott Warren Powell wscott@princeton.edu powell@princeton.edu. Approximate Knowledge Gradient Policy. Simulation of Policy. Introduction.

E N D
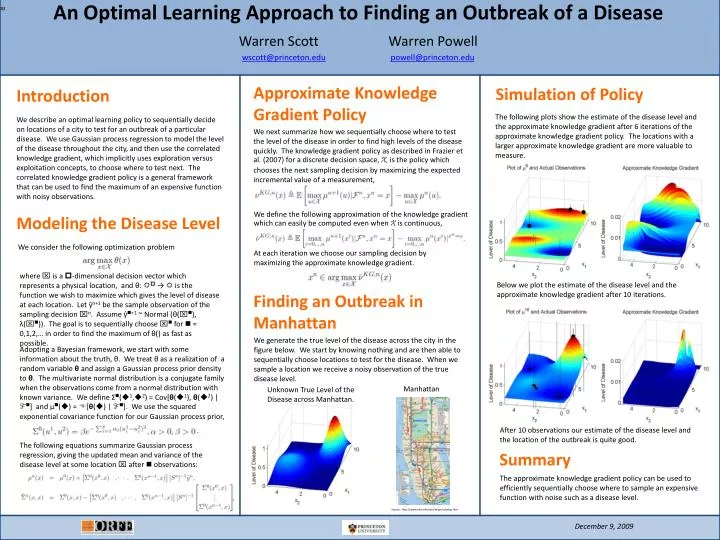
An Optimal Learning Approach to Finding an Outbreak of a Disease Warren Scott Warren Powell wscott@princeton.edupowell@princeton.edu Approximate Knowledge Gradient Policy Simulation of Policy Introduction The following plots show the estimate of the disease level and the approximate knowledge gradient after 6 iterations of the approximate knowledge gradient policy. The locations with a larger approximate knowledge gradient are more valuable to measure. We describe an optimal learning policy to sequentially decide on locations of a city to test for an outbreak of a particular disease. We use Gaussian process regression to model the level of the disease throughout the city, and then use the correlated knowledge gradient, which implicitly uses exploration versus exploitation concepts, to choose where to test next. The correlated knowledge gradient policy is a general framework that can be used to find the maximum of an expensive function with noisy observations. We next summarize how we sequentially choose where to test the level of the disease in order to find high levels of the disease quickly. Theknowledge gradient policy as described in Frazier et al. (2007) for a discrete decision space, X,is the policy which chooses the next sampling decision by maximizing the expected incremental value of a measurement, We define the following approximation of the knowledge gradient which can easily be computed even when X is continuous, Modeling the Disease Level We consider the following optimization problem At each iteration we choose our sampling decision by maximizing the approximate knowledge gradient. where x is a p-dimensional decision vector which represents a physical location, and θ: Rp → R is the function we wish to maximize which gives the level of disease at each location. Let ŷn+1 be the sample observation of the sampling decision xn. Assume ŷn+1 ~ Normal (θ(xn), λ(xn)). The goal is to sequentially choose xn for n = 0,1,2,… in order to find the maximum of θ() as fast as possible. Below we plot the estimate of the disease level and the approximate knowledge gradient after 10 iterations. Finding an Outbreak in Manhattan We generate the true level of the disease across the city in the figure below. We start by knowing nothing and are then able to sequentially choose locations to test for the disease. When we sample a location we receive a noisy observation of the true disease level. Adopting a Bayesian framework, we start with some information about the truth, θ. We treat θ as a realization of a random variable θ and assign a Gaussian process prior density to θ. The multivariate normal distribution is a conjugate family when the observations come from a normal distribution with known variance. We define Σn(u1,u2) = Cov[θ(u1), θ(u2) | Fn] and μn(u) = E[θ(u) | Fn]. We use the squared exponential covariance function for our Gaussian process prior, Manhattan Unknown True Level of the Disease across Manhattan. After 10 observations our estimate of the disease level and the location of the outbreak is quite good. . The following equations summarize Gaussian process regression, giving the updated mean and variance of the disease level at some location x after n observations: Summary The approximate knowledge gradient policy can be used to efficiently sequentially choose where to sample an expensive function with noise such as a disease level. . Source: http://www.mta.info/nyct/maps/submap.htm December 9, 2009