Download
1 / 30
300 likes | 381 Views
Warm-Up: What’s the Impact?. Describe what is going on in this picture. What is the environmental impact? Where is the pollution?. Warm-Up: What’s the Impact?. Water lost to the atmosphere or blown away from the crops.

E N D
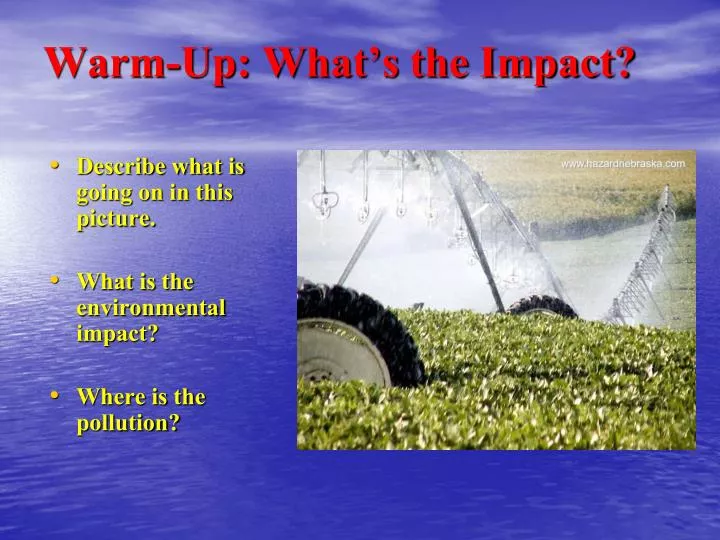
Warm-Up: What’s the Impact? • Describe what is going on in this picture. • What is the environmental impact? • Where is the pollution?
Warm-Up: What’s the Impact? • Water lost to the atmosphere or blown away from the crops. • Water carries pollutants from the fertilizers into the ground and can seep into the water supply.
Water Pollution • 1.2 billion people worldwide do not have access to clean water • Each day almost 10,000 children <5 years old in Third World countries die as a result of illnesses contracted by use of impure water.
Water Pollution • Water Pollution = degradation of water quality (biological, chemical, or physical) • Judged according to the use of the water • Pollutant = any substance that in excess is known to be harmful to life
Surface-Water Pollution & Treatment • Point Source = specific, confined pollution Image: EPA
Surface-Water Pollution & Treatment • Non-point Source = diffuse, intermittent pollution • Influenced by: • Land-use Hydrology • Native vegetation • Topography • Geology • Difficult to control, contains multiple pollutants
Pollutants • Oxygen-demanding waste • Disease causing organisms • Nutrients • Oil • Hazardous Chemicals • Heavy Metals • Radioactive Materials • Thermal Pollution
Oxygen-Demanding Waste • Bacteria in water consume organic matter and use oxygen in the process. • Too much bacteria in the water causes oxygen shortage so fish and other organisms die. • Urban sewage is prime breeding ground for bacteria • may wash into natural systems via flood, earthquake, human error, etc.
Pathogenic Organisms • Microscopic • Disease-causing: cholera, typhoid, hepatitis, dysentery • Monitor: E. coli • Found in human or animal waste E. coli • May wash into natural systems via flood, earthquake, human error, etc.
Nutrients • Phosphorus & nitrogen • used in fertilizers, detergents, sewage-treatment plants • Results in rapid growth of algae which: • covers water surface blocking light from reaching plants below • consumes oxygen, killing off organisms The green color along the coast is an algal bloom- Fish die Image: The SeaWiFS Project, NASA/Goddard Space Flight Center, & ORBIMAGE
Nutrients • Mississippi Dead Zone • Offshore in Gulf of Mexico • Area ~size of New Jersey every summer • Mississippi River drains ~40% of continental U.S. – high levels of nutrients
Oil Environmental Hazard Symbol • Exxon Valdez, Alaska • March 1989 • Worst oil spill in U.S. history • Ran aground • >250,000 barrels of oil spilled • area was one of most pristine and ecologically rich in world • Short-term impacts: • Many seabirds and mammals were killed • Fishing and tourism disrupted • Long-term impacts: ??? 1999 High line of oil at Herring Bay Image: NOAA Office of Response & Restoration
Hazardous Chemicals • Methyl Tertiary Butyl Ether (MTBE) additive leaking into groundwater: • Underground gas leaks • Storm runoff from gas tanks/leaks on surface • Santa Monica, California, 1997 • MTBE pollution forced city to stop pumping groundwater eliminating 50% of drinking water supply.
Heavy Metals • Lead, mercury, zinc, and cadmium • metals can dissolve and become incorporated into plants, crops, and thus animals and humans. • Sources: some natural, others burning fossil fuels, incinerating waste, processing metals. • It is believed that human activity has increased mercury levels in the atmosphere 2-3x and 1.5% per year • Particles in the atmosphere get rained out and soak into soil
Thermal Pollution • Thermal pollution = artificial heating of water • Caused primarily by hot-water emissions from industrial operations and power plants. • Problems: • Contains less oxygen • Favors different species • May increase growth rates of undesirable species • May benefit some desirable species especially in winter
The Cuyahoga River Fires • June 22nd, 1969
A legacy is established… • This was not the first time that the river had caught on fire. • Fires occurred on the Cuyahoga River in • 1868,1883,1887,1912,1922,1936,1941,1948, and in 1952.
Depicts a fire in December of 1952 on the Cuyahoga River • $1,500,000 worth of damage
Shows a fireboat breaking up an oil slick on December 19, 1961 (9 years later).
It depicts the aftermath of the June 22, 1969 fire, as the fire boat continues to break up oil slicks. Part of this picture was run on the front page of The Plane Dealer the next day. The caption read, “Flames leaped up from floating oil wastes dumped in the Cuyahoga River by waterfront industries yesterday and burned this trestle and another before a fireboat and units from three fire battalions brought it under control. Lasted 30 min. & damage was $50,000.”
TIME reports (August 1st, 1969) • Some River! Chocolate-brown, oily, bubbling with subsurface gases, it oozes rather than flows. "Anyone who falls into the Cuyahoga does not drown," Cleveland's citizens joke grimly. "He decays". . . The Federal Water Pollution Control Administration dryly notes: "The lower Cuyahoga has no visible signs of life, not even low forms such as leeches and sludge worms that usually thrive on wastes." It is also -- literally -- a fire hazard.
Repercussions of “the Fire” • August 1st 1969, Time Magazine article, the river fire began to draw more attention. Especially among environmentalists, the river fire stood as a clear example of the need to improve the water quality in lakes and rivers. • In October of 1969, federal officials passed a bill that would grant states more insurance that projects aimed at improving water quality would receive federal support. The Cuyahoga River served as a prime example of the need for the bill. • Also in October, federal water pollution officials pressured four steel companies to "expedite installation of facilities to clean their large waste discharges into the filthy Cuyahoga and Maumee Rivers“.
Repercussions of “the Fire” • The first Earth Day in 1970 increased awareness for an environmental agenda. • In 1972 the Clean Water Actwas passed, "restricting industrial dumping into the nation's waterways". • The river catching fire "proved to be the instrumental rallying point in the passage of the Clean Water Act". The Cuyahoga had become a symbol of the need to improve water quality.
Hurricane Floyd • North Carolina, 9/1999 • 2nd largest pig farming in nation • Environmentalists saw danger; farmers resisted • Daily manure and urine flushed into holding ponds • Degrade via natural bacteria • Floods from hurricane washed waste into rivers and floodwaters into towns, homes, etc.
Federal Legislation • July 2000, President Clinton passed new legislation • Protect rivers and streams from nonpoint source pollution • Environmental Protection Agency work with state and local agencies to develop programs to reduce pollution over next 15 years • Opposed by Congress, industry, some agricultural groups, even Chamber of Commerce