Download

1 / 50
500 likes | 561 Views
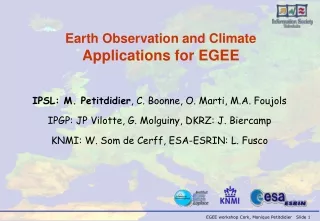
Assessing the Utility of Earth Observation Measurements Informing Energy Sector Applications. Richard Eckman NASA Headquarters, Washington, DC Richard.S.Eckman@nasa.gov ESIP Winter Meeting, January 5, 2011. Outline.

E N D
Assessing the Utility of Earth Observation Measurements InformingEnergy Sector Applications Richard Eckman NASA Headquarters, Washington, DC Richard.S.Eckman@nasa.gov ESIP Winter Meeting, January 5, 2011
Outline • Funding and Coordination activities: NASA Applied Sciences Program, GEO, and CEOS • Connecting to Stakeholder Decision Tools: • Solar energy resource assessement, Space-Weather impacts on energy grid Energy Load Forecasting, Building Monitoring • Assessing Value: Methodologies, some results • Conclusions
NASA Applied Sciences Program • Applied Sciences Goal: The Applied Sciences program extends NASA Earth Science research and observations for practical use in environmentally-related decision and policy making. • Serves society through: • Demonstrating, through partnerships with public organizations, improvements to their ability to manage and plan natural resources and to make better environmental predictions, decisions, and policy. • Serves the Earth science community by: • Demonstrating and communicating the utility and potential of Earth science for societal benefit to a broad audience • Complementing R&A programs through applied research in strategic areas • Providing the applications “viewpoint” to the research community (e.g., working with GEO and CEOS) • Forging partnerships with “nontraditional” organizations (e.g., NREL, USDA, Battelle, NRCan, ESA, DLR, Universities, Private Sector)
2000-2011 Planning: Highlights • Developing applications for monitoring renewable energy sources • Improving forecasting of fluctuationsand intermittency • Promoting collaboration among users and providers www.earthobservations.org Renewable Energy – Managing Uncertainty
CEOS • Committee on Earth Observation Satellites (CEOS) • 28 Member and 20 Associate agencies and organizations (e.g., DLR, ESA, JAXA, NASA, …) • Pursuing near-term space-based actions that directly support GEO tasks
The NASA POWER Project POWER = Prediction of Worldwide Energy Resource Objective: Improve the public and private capability for integrating environmental data from NASA’s satellite-based analysis and modeling research into sound management of energy production and energy efficiency systems. Goals: • Establish partnerships to facilitate the integration and adaptation of NASA satellite analysis and modeling data into electric power industry Decision Support System’s (DSS) and databases. • Target datasets for Electric Power, Renewable Energy, Energy-Efficient Building Design, and Biomass Crop Development Industries • Transition operational capabilities to government and/or private sector entities.
Relevant NASA Science Data Sets Meteorological Information from GMAO
Relevant NASA Science Data Sets Global Monthly Irradiance for 2000 (from GEWEX SRB)
Relevant NASA Science Data Sets FLASHFlux: Global TOA and Surface Fluxes within 1 week of observation from Terra and Aqua FLASHFlux (CERES/MODIS, GMAO) Daily Average Solar Irradiance ( Wm-2)
NASA SSE: Updated Release v6.0 • Surface meteorology and Solar Energy database (SSE) • 23 years of data • Updated solar algorithm • Improved validation • Increased accessibility including regions/time series • Direct connection to 3 renewable energy DSS tools eosweb.larc.nasa.gov/sse
Current Climate and Energy Projects • Building Climate Zone data sets (DOE, ASHRAE) • ROSES09 Feasibility: 1 year • Purpose: Demonstrate usefulness of developing building climate zone maps in regional areas from downscaled assimilation and satellite products • Advanced Long-term Solar Mapping (NREL, NCDC, SUNY) • ROSES09 DECISION: 4 year (starting FY10) • Purpose: Develop and deliver methodology to NREL for production of solar resource maps from NASA Science to NCDC operations • Near-Real Time Products for Energy/Ag Applications • Purpose: Enhance/Maintain data product from from CERES FLASHFlux to web sites for energy and agriculture applications • Solar Resource Knowledge Management (IEA, Task 36) • Purpose: Benchmark and determine best practices for validation of satellite-based solar resource, improve dissemination of data sets through web based tools, evaluate long-term variability and forecasts
Current Data Product Data Flow Science Inputs Applied Sciences (eosweb.larc.nasa.gov/sse) GEWEX SRB ISCCP GEOS-4 NCAR MATCH TOMS/TOVS GPCP 24 Year Time Series POWER SSE Rel. 6.0 FLASH- Flux Within 1 Week Of Real-Time CERES MODIS GEOS-5 NCAR MATCH SMOBA (OMI) TRMM/GPCP Energy Resource and Load POWER Agricultural Crop Projections (power.larc.nasa.gov)
POWER: Hub for Applications • Energy Forecasting • MiniCAM (PNNL) • Solar Forecasting (SUNY, NREL) EARTH SYSTEM MODELS • Renewable Energy & Energy Efficiency • RETScreen (NRCan) • HOMER (NREL) • IEA Task (NREL) • WMO Buildings • ASHRAE • Earth System & Climate Change: GMAO Analysis (GEOS v4.0, v5.1; MERRA) • Atmospheric Analysis Projects: ISCCP, SRB, FLASHFlux (CERES, MODIS), GPCP Data • Selected Proposals • Crop-Yield Modeling • (USDA, U.Neb., U. Ga) • SWERA 2 (USGS, NREL) • Energy Load Forecasting (Battelle, MSFC) NASA/POWERPrototype Data Set Generation Data EARTH OBSERVATIONS • Web Prototypes • SSE • Sustainable • Buildings • Agroclimatology • Satellite: GOES, POES, TRMM, Terra, Aqua, TOMS, SORCE, Aura, CALIPSO, CloudSat, Glory, GPM, NPP • Land:Aeronet, BSRN, ARM, SURFRAD Data *Future Mission
POWER Sustains Growth of SSE Prototype and Web Interface Surface meteorology and Solar Energy (SSE) Web Interface Usage Now >75,000+ users, ~2.5X increase since 2007, >1900 new users per month in 2010, 152 Countries > 4.25 million data requests (18.5 mil total hits) and since 1997 inception
POWER Sustains Growth of SSE Prototype and Web Interface • Web site hosted by ASDC (no charge) • Site responsible for 88% of all data requests • Now over 30,000 unique users • 116 different countries • Business (72%), University (12%), Government/Military (7%), Private Citizens (7%), Organization (2%) Sustained growth due to improved data sets from science research and new partnerships • Release 6: replaced solar data and Met data due to upgrades from SRB and GMAO science; now 22 years
Estimating Accomplishment Value • Usage Statistics: Measure of relevance and value • Overall usage and by domain including international (i.e., .com, .org, .gov, .mil; Au – Australia) • Statistical information on data requests: location, parameters • New user information: indicates growth • User question & comments; web links to sites • Direct Decision Support Usage: Specific Value • Ex: RETScreen (over 255,000 users in36 languages, est. $5B in cost savings), HOMER, Ventyx Velocity Suite (Electric Utilities) • Usage by Government reports: Policy Value • Ex: Dept. of Interior, PNNL Climate Change assessments • Industry Standards: Industry wide influence • Ex: IEA, ASHRAE • Specific Case Studies: Measureable impacts by case
Connecting to Decision Tools and End Users Direct Linkage to Renewable Energy Decision Support power.larc.nasa.gov
NRCanRETScreen • Natural Resources Canada-funded program
RETScreen-NASA Partnership • Natural Resources Canada-funded program • RETScreen goals: • Build the capacity of planners, decision-makers and industry to implement renewable energy, cogeneration and energy efficiency projects • Reduce the cost of clean energy pre-feasibility studies • Partnering with NASA since 2000 • www.retscreen.net
RETScreen’s Reliance on NASA Data • Direct query of NASA SSE data • >276,000 users in 222 countries • 1000 new users every week • Release 4: in 26 languages RETScreen Climate Database NASA data In Situ data Points represent world’s cities (~10,000). Red have in situ observations. Blue defer to NASA LaRC data sets (~5,000). Data for locations between points are found through a direct link to SSE.
NASA/HOMER (NREL) Partnership NREL HOMER Micropower Optimization Model HOMER is a computer model that simplifies the task of evaluating design options for both off-grid and grid-connected power systems for remote, stand-alone, and distributed generation (DG) applications. Highlighted in CCSP SAP 5.1 as a case study in decision support using Earth observations NASA and other Earth observation data sources critical to its success (e.g., solar from LaRC; AOD from GSFC GOCART model, MODIS, MISR, TOMS; Digital land cover from NASA & USGS) Used extensively around the world for determining the optimal mix of power technologies for meeting specified load conditions at specified locations HOMER automatically accesses and inputs the NASA SSE data for the specific location that the model is analyzing. Collaboration with NASA ROSES-funded SWERA II task at USGS EROS data center. www.nrel.gov/homer
HOMER Solar Resource • User can plot results in a number of ways
Space Weather Impacts on Power Grid March 1989 X-class flare led to GIC-induced 10-hour blackout throughout Quebec Solar Shield Project: conducted by NASA in collaboration with EPRI http://ccmc.gsfc.nasa.gov/Solar_Shield
Space Weather Impacts on Power Grid • Solar Storm of 1859: Largest recorded geomagnetic storm in history. At the time, telegraphy was only ~15 years old. Networks in Europe and North America failed. • A similarly sized storm occurring today could be devastating to space-based assets, communications (Internet), and the power grid. • Value of Earth observations to improve forecasting of events could be huge.
NASA Products to Enhance Energy Utility Load Forecasting • Funded by the NASA Applied Sciences Program • Project Goal: develop applications of NASA products to meet the needs of energy companies for both short-term and long-term planning • Partners: Battelle, Ventyx, NASA Langley Research Center, NASA Marshall Space Flight Center
Project Motivation • Current daily load forecasts have mean absolute percent error(MAPE) values of 5%-7% for natural gas companies, and 1%-3% for electric companies • Uncertainty in forecasts has the potential to waste money and resources • Refinement to weather inputs could lead to substantial cost savingsand more efficient use of resources
Cost Savings: Electric Example of a Cost Benefit Analysis performed for use of a satellite weather product in electric forecasting • With an estimated 10% reduction in error in 3-hour temperature forecasts, within-day models, and conservative assumptions: • U.S. electric utilities (total production in 2000 of 3,413,000,000 MWH) would save: • $479 Million/year (assumes spotprice in 2002 dollars of $41.3 / MWH) • Based on reduction of short-term power production and purchase • 3-hour forecast only – larger improvements possible with better 24-hour forecast • Temperature accuracy – wind speed, precipitation not included Source: http://www.goes-r.gov/downloads/GOES-R%20Sounder%20and%20Imager%20Cost%20Benefit%20Analysis%20(CBA)/GOES-R_CBA_Final_Jan_9_2003.pdf
Project Steps Phase 1: Historical Testing – compare load forecast results with and without NASA satellite weather data. Phase 2: Operational Testing - conduct real-time testing, fine tune and document benefits. Phase 3: Nationwide Transition - transition documented improvements for sustained use of NASA resources by energy utilities nationwide, in a variety of load forecasting tools. Climate Change Investigation: Assess NASA climate data, model products, and projections to identify those of potential value to utilities for long-term (seasonal to 40 years) planning. For example, climate change impacts on: • Infrastructure • Load • Integration of renewable energy such as wind • Resource availability (e.g., water).
Weather Data in Energy Load Models • Problem – surface reporting stations and forecast sites are limited • few and usually far apart • not in representative areas because of terrain, or influenced by local effects Preliminary study showed that the use of more data improves load forecasts • Weather data needs to be: • Available in real-time (observations) • Forecast at 1-3 hour intervals • Forecast 1-10 days in future • Parameters include Temperature (also daily max / min), Relative Humidity, Wind (speed/direction), Precipitation, Cloud cover, Solar energy, etc.
NASA Historical Data Sets • Data sets spanning January 1983 to present • Long-term satellite-based analysis of clouds, solar energy, and temperatures, 1ox1o resolution • Satellite/ground-based precipitation products from the Global Precipitation Climatology Project ,1ox1o resolution • Surface meteorological observations remapped for 1ox1o resolution Average Daily Solar Radiation, January 2000 NASA Langley Surface Meteorology and Solar Energy (SSE), http://eosweb.larc.nasa.gov/sse/
High resolution model data provides detailed temperature information over regions of interest NASA High-Resolution Forecasts • High resolution data from NASA satellites is used to diagnose current weather and improve forecasts • Forecasts are 4 km x 4 km resolution, Hourly • New NASA model inputs are improving short-term forecasts: • High resolution maps of sea surface temperature • Assimilation of temperature and moisture profiles NASA Marshall Short-term prediction Research and Transition Center (SPoRT)
Battelle The Business of Innovation Historical Testing Completed • National Fuel, Gas Utility, Buffalo, NY
Historical Testing Details:National Fuel • Monthly MAPE results show improvements across the entire year with NASA data • Peak demand months reduced - up to 4.3 percentage pts. • Significant shoulder month improvements – up to 3.7 percentage pts. AVG = 8.3 AVG = 6.4 AVG = 8.5 AVG = 5.4
Historical Testing Completed • Arkansas Electric Cooperative, Electric Utility
Operational Testing Just Started • 3 out of 4 participating utilities (not Arkansas Electric yet) • Have not encountered peak load seasons (summer and winter)
PNNL Integrated Assessment Model Initialization with NASA Data PNNL/Joint Global Change Research Center uses NASA POWER data sets for initiation of MiniCAM 50-year energy market forecasts for policy planning Direct Solar Irradiance for areas with 50 or less no-sun days per year Forested and Agricultural Areas Excluded
Long-term Climate Information For Building Design Global Building Design Climate Zones (with ASHRAE and DOE) Location Specific Traditional Architectural Comfort Zone Design Charts (with AIA) Location Specific Daily/Monthly Averaged Climate Information 30 Years Needed!
POWER for High Resolution Building Climate Zone Maps • Long-term climate zone maps determine building codes and guidelines for buildings by US county • Current maps statistics • Interpolated surface Measurements of • Monthly/annual T • Annual HDD/CDD • Annual precipitation • Investigating use reanalysis for these maps
POWER for High Resolution Building Climate Zone Maps • MERRA Climate zones using ASHRAE/DOE definitions at 1/2 x 2/3 degree resolution
Building Monitoring and Targeting • Monitoring and Targeting: gaining and maintaining control over energy consumption through measurement and analysis followed by well-directed actions. • Purpose: energy cost savings for budgeting, evaluation of energy efficiency upgrades, product/service costing • NRCAN CETR RETScreen leading effort for newly formed building monitoring and targeting program • Need global near-real time (within 1 month) solar and meteorological (I.e. heating degree day) data sets • FLASHFlux with operational GMAO assimilation perfectly suited by providing daily and monthly estimates of parameters • Testing on NASA Langley Research Center buildings
GMAO Solar Irradiance Forecast Initial Conditions 1230Z 8/5/07 6 Hr Forecast Condition 12Z 8/5/07 30 Hr Forecast Condition 12Z 8/6/07 Benchmaking Solar Forecasts Vital for assessing potential large scale PV and/or CSP production when integrating into into traditional power grid Multi-Model Solar Irradiance Comparison Draft courtesy Perez, SUNY
Next Steps • Advanced Long-term Solar Mapping (NREL) • Earth System Science models (ESSM): GMAO MERRA, GOCART • Satellite-based: ISCCP B1U (w/ 8km pixels), TOVS-TOMS • Solar Energy Forecasting (NREL, SUNY) • Earth System Science models (ESSM): GMAO forecasts • Satellite-based: FLASHFlux (for validation) • Building Targeting and Monitoring (NRCan) • ESSM: GMAO operational assimilation • Satellite-based: FLASHFlux • Building data sets for design (DOE, ASHRAE) • ESSM: GMAO GEOS-4, MERRA, GOCART • Satellite-based: GEWEX SRB • Load Forecasting (Battelle, Ventyx) • ESSM: GMAO operational assimilation, forecasts; SPORT
Conclusions • NASA Energy Management applications have yielded significant results in national and international energy programs through transfer of science results toimprove decision making • Successes involve supporting renewable energy and energy efficient technology optimization • Model of success has been long-term partnerships featuring the development and dissemination of specifically tailored data sets • Data sets made available through web-based interfaces provide opportunities for new projects and new partnerships worldwide
Conclusions (cont’d.) • Assessing the value of information requires different methodologies based on the project under consideration. • Some projects have clearer metrics to assess success • A Possible Next Step: Socio-Economic Benefit Survey • Purpose: Measure by sector usage, user survey analysis, case studies the current and future impact of providing global solar and meteorological data sets. • More work required! Thanks to Paul Stackhouse, Jim Hoell, and Erica Zell for the use of some slides.
GEOSS: First Energy Demonstration Hosted by École des Mines de Paris
SWERA 2: Renewable Resources for Developing Nations • USGS-led ROSES Proposal • Data archive, • user interface • at UNEP GRiD facility • NASA role: supply global data parameters • www.swera.net
CEOS Member Agencies Contribute ToInternational Energy Agency Task • International collaboration representing 8 nations; >15 organizations • 5-Year Task led by NREL • NASA contributing expertise on solar resource estimation and validation, user and interface information, data sets and research (results from GEWEX SRB and GEWEX Radiative Flux Assessment)