Download
1 / 30
310 likes | 388 Views
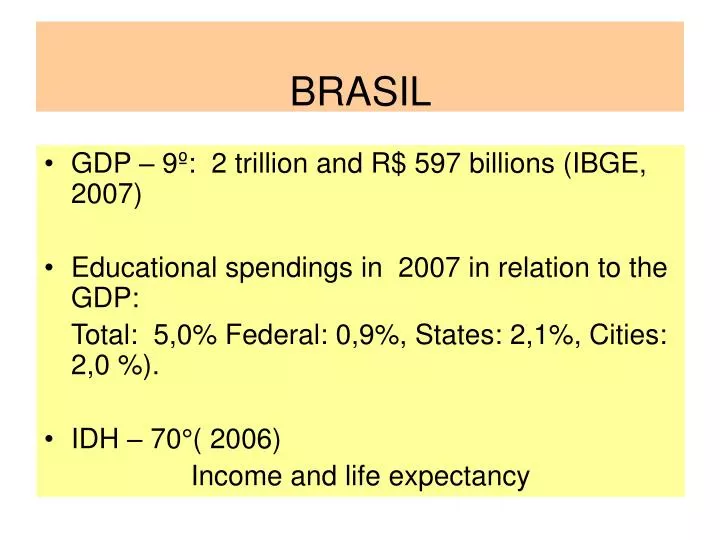
BRASIL. GDP – 9º: 2 trillion and R$ 597 billions (IBGE, 2007) Educational spendings in 2007 in relation to the GDP: Total: 5,0% Federal: 0,9%, States: 2,1%, Cities: 2,0 %). IDH – 70°( 2006) Income and life expectancy. Diagnose. Population: 170 millions 65,2% up to 2 mininum wage

E N D
BRASIL • GDP – 9º: 2 trillion and R$ 597 billions (IBGE, 2007) • Educational spendings in 2007 in relation to the GDP: Total: 5,0% Federal: 0,9%, States: 2,1%, Cities: 2,0 %). • IDH – 70°( 2006) Income and life expectancy
Diagnose • Population: 170 millions • 65,2% up to 2 mininum wage • 11,2 % illiterate • 27,5% upt to 3 years of schooling • 60,4% have not concluded elementary school. (CONAE – IBGE, 2003)
Youth • 30% of young students (18 to 24) are studying, 71% of them are in elementary and high school. (CONAE)
DIAGNÓSTICOBRASIL • According to BBC (2007), Brazil is the country that spends less with education – 34 countries analised by OCDE (Organização para Cooperação e Desenvolvimento Econômico). • Brasil is the country that shows the smallest investiment by student (since elementary school to higher education), spending an average of US$ 1.303 per year (about R$ 2.488). • The 30 countries of OCDE spend an average of US$ 7.527 (R$ 14.376), and the country which spends more in education is Luxembourg US$ 13.458 (R$ 25.705). In Chile, US$ 2.864 (R$ 5.470) • Source:http://www.bbc.co.uk/portuguese/reporterbbc/story/2007/09/070918_educacaoocde_ba.shtml
In 2003 • Black population Elementary school: 92,7% High school: 31,9% Higher education: 4,4% Fonte: IBGE/Pnad microdados. Elaboração: Ipea/Disoc e Unifem. Fonte: http://www.planalto.gov.br/seppir/pesquisas_indicadores/genero/retrato_das_desiguladades/tabelas/2_Educacao/2.7.pdf
DATA FROM SAEB –SISTEMA NACIONAL DE AVALIAÇÃO BÁSICA 2003- MEC 59% OF CHILDREN WHO CONCLUDE THE 4TH GRAGE DON’T KNOW HOW TO READ. Fonte:http://revistaepoca.globo.com/Epoca/0,6993,EPT560854-1664,00.html http://www1.folha.uol.com.br/folha/educacao/ult305u13727.shtml
Proportion of children - 7 to 14 - attending school in 2001 Brazil and regions 7 to 14 7 to 9 10 to 14 Brazil 96,5 96,9 96,2 Norte 95,3 94,7 95,6 Nordeste 95,2 95,5 95 Sudeste 97,4 98 97 Sul 97 97,9 96,5 Centro-Oeste 97,1 97,7 96,8
Brazil • Fuctional illiteratein 2002 – 26%
Brazilians with less that 15 years of formal schooling • Sudeste 5,5% • Sul 4,6% • Centro-Oeste 4,3% • Nordeste 2,0% • Norte 1,8%
INSTRUCTION AND MONTHLY WAGE Em uma análise entre rendimentos e escolaridade, a pesquisa aponta que entre os 20% mais pobres no Brasil era de 3,9 anos. Já entre os 20% com maior renda a média era de 10,2 anos.
Average of years studied by Brazilian workers was 5,7 years (1996) • Increased to 7,2 in 2006
7% 9% 5% 6% 73%
Censo 2006 In Pernambuco – 509 Cursos
Censo 2006 • Em 2006 foram oferecidas 2.629.598 vagas. • Sendo 2.298.443(87,5%) IES Privadas e 331.105 (12,53%) IES Públicas. • Tivemos 5.181.509 candidatos para as vagas (média de 1,98). • Ingressaram 1.448.509 candidatos, ou seja, 44% das vagas ficaram ociosas. Menos de 3% das vagas ociosas são do setor público
Elitism of higher education in a public University • 60% belonged to the 20% wealthier part of the population • 3,4% belong to the 20% poorer (ibge)
Dificuldades das Instituições de Ensino na Geração do Conhecimento • Crise de identidade que a educação superior sofre em todo o mundo. • Evasão do ensino superior ( 45% abandonam o primeiro curso superior) (IBGE ) • Vagas ociosas (Apenas 69% dos universitários concluem seu curso) • Baixa quantidade de doutores entre os docentes. • Carreiras pensadas mais em função dos interesses da escola e professores que das necessidade da sociedade
Dificuldades das Instituições de Ensino na Geração do Conhecimento • Falta de equipamentos e infra-estrutura • Dificuldades de acompanhamento dos estágios • Falta de sintonia entre a academia e setor empresarial • Dificuldades de um sistema de avaliação interna e externa a IES.