Download
1 / 24
240 likes | 321 Views
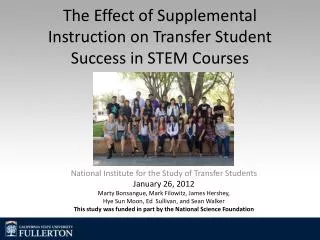
The Effect of Supplemental Instruction on Transfer Student Success in STEM Courses. National Institute for the Study of Transfer Students January 26, 2012 Marty Bonsangue, Mark Filowitz , James Hershey, Hye Sun Moon, Ed Sullivan, and Sean Walker

E N D
The Effect of Supplemental Instruction on Transfer Student Success in STEM Courses National Institute for the Study of Transfer Students January 26, 2012 Marty Bonsangue, Mark Filowitz, James Hershey, Hye Sun Moon, Ed Sullivan, and Sean Walker This study was funded in part by the National Science Foundation
California State University Fullerton • Second largest univ. in the 23-campus CSU system • >35,000 students enrolled • 57% Female • HSI Status • Ethnic Distribution- Fall 2011 • Hispanic 32% • White 30% • Asian/Pacific Islander 22% • African American 3% • Indian, Multiple Race Non-Hispanic, International Students and Unknown 13% • Admit approx. 5,000-6,000 transfer students per year
Biology 171 Evolution and Biodiversity • First course in the Biology Major at CSUF • Large lecture – 180 to 240 students per class • 40 – 60% Success Rate • Topics & Skills • Organismal Diversity • Microevolution • Macroevolution • Descriptive Statistics, Presentations, Scientific Writing
Math 150A – Calculus I • First course in the Math, Computer Science, and Engineering Majors at CSUF • Small classes – 25 to 40 students per class • 30 – 60% Success Rate • Topics & Skills • Functions • Derivatives and Integrals • Applications • Presentations, Mathematical Writing
What is Supplemental Instruction? • Developed at University of Missouri at Kansas City • Targets Tough Classes, NOT Students or Professors (< 70% passing rates) • Difficult Material, not Evil Professor
More on SI • Four Key Players • SI Supervisor • Faculty • SI Leaders • Students • Leaders are trained, go to class and model good student behavior, and meet regularly with supervisor and faculty
SI at CSUF • Began in 2008 with four classes (2 secs Calculus I, 2 secs Biodiversity) • In Spring 2012, approx 800 STEM students participating across 45 sections • Forty-five undergrad SI leaders involved • CollAlg, Precalc, BusCalc, Calc 1 & 2, Biodiversity, GenChem, OChem, & CompSci • All students enrolled in course are actively invited and recruited
Summary of SI Results • Success rates around 80 % (SI) v. 50 % (non-SI) • GPA around 2.5 (SI) v. 1.7 (non-SI) • Significant results for each ethnic and gender group • Strongest effects observed for URM students and transfer students • No differences in academic predictors for SI and non-SI students (overall & within groups)
Native Students Course GradeCalc I Course Grade: URM by SI Partic.
Transfer StudentsAcademic Predictors Non SI SI No. of Students 40 34 Transfer GPA 2.95 2.97
Transfer Students OnlyCalculus I Results Non SI SI Course Grade 1.43 2.40 Success Rate 45 % 79 %
Transfer Students Calc I Course Grade: Ethnic. by SI Partic.
Summary • Si participation linked with higher passing rate and course grade for all groups (ethnicity, gender, transfer status) • No academic predictor differences between SI and non-SI students • Most dramatic results observed for URM transfer students (based on limited sample) • Exit survey shows 90 % + students overall feel SI was helpful or extremely helpful
Future Directions • SI Helps Level the Playing Field for Students by Gender, Ethnicity, and Transfer Status • SI is Building an Academic Program for Future Teachers (SI Leaders) • The Results Make a Strong Case for Institutional Funding
Issues and Challenges • Efficiently Identifying Transfer Students Enrolled in a STEM course • Effectively Recruiting Transfer Students in a Timely Way • Consistently Funding and Staffing Strong SI Programs in STEM