Download
1 / 58
580 likes | 583 Views
Accessing iView I&O 2G. To access iView , open a patient’s chart in eKiDs PowerChart by double clicking on the patient’s name in the PAL or Patient List. This will open the selected patient’s chart where you can select the iView I & O 2G chart tab in the menu. Components of iView I&O 2G.

E N D
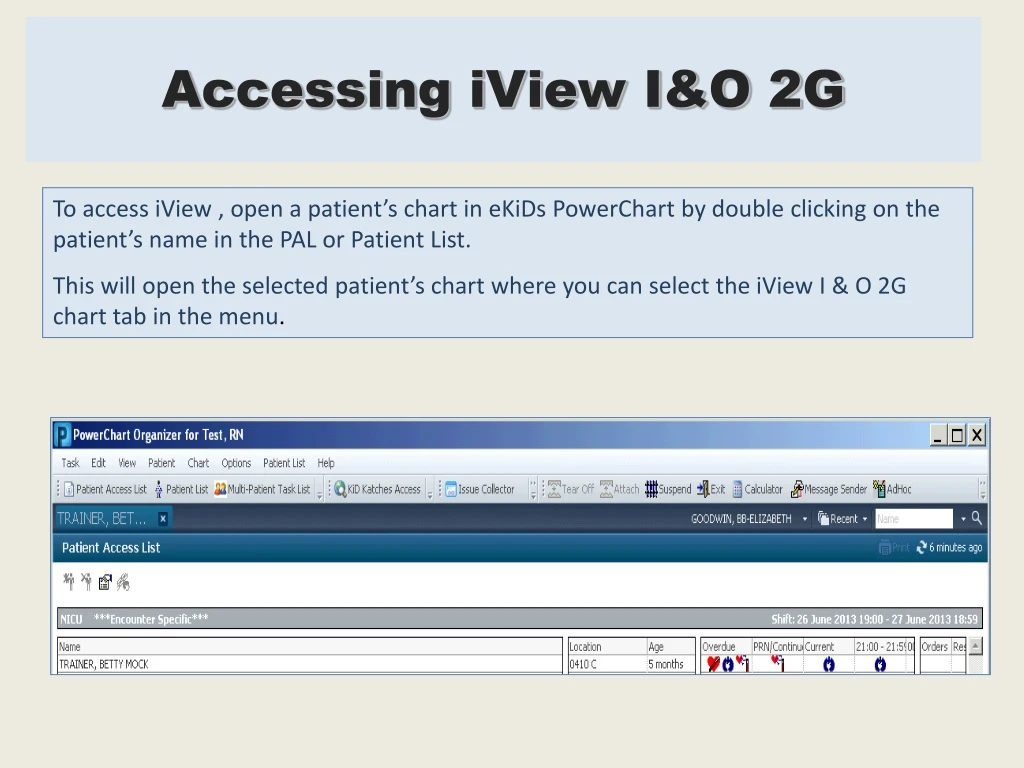
Accessing iView I&O 2G To access iView , open a patient’s chart in eKiDs PowerChart by double clicking on the patient’s name in the PAL or Patient List. This will open the selected patient’s chart where you can select the iView I & O 2G chart tab in the menu.
Components of iView I&O 2G • The Interactive View or iView (iView/I&O 2G) is an interactive spreadsheet within eKiDs PowerChart . • It provides clinicians with a means of viewing, documenting and monitoring a wide variety of patient data in a single area. • From iView you can: • Customize what sections are displayed • Select what data is included • Decide how that data is organized • You can directly chart and view result details from iView, however, documentation completed by Students will remain in an “unauthenticated” status until reviewed by those with authority to approve.
Components of iView I&O 2G iView I & O 2G is located on the menu bar within the patient’s chart. It is a means of viewing a wide variety of patient data in a single area.
Components of iView I&O 2G Two major sections of iView are #1 The Navigator The navigator is a table of contents for iView that displays the different views available to you. Each individual view within the Navigator is called a Band.
Components of iView I&O 2G • Bands • The Bands are a group of sections within the Navigator. • Different Bands will display based on your security. • Sections • The sections are a group of charting questions within each band.
Components of iView I&O 2G #2 The Interactive View Area The interactive View is where results are documented. The existing results can be reviewed here and modified if necessary.
Components of iView I&O 2G Sections contain related groups of items used for completing the patient’s documentation. These sections can be defaulted in by the system or you can customize what is included in the section as needed for documentation. (Customizing bands will be included in a later lesson.) The Date and Time columns display for each section showing the date and time of the documentation within the selected cells. They can be edited and added based on documentation needs by right clicking on the time or inserting a new date/time.
Components of iView I&O 2G • Information Date Range Bar • The Information Date Range Bar is a blue bar at the top of the iView I&O 2 G Flowsheet. • The Information Date Range Bar displays the time range you are viewing in the flowsheet. • The Information Date Range Bar can be changed to display different times and date ranges as needed to locate and view results.
Components of iView I&O 2G iView / I & O 2 G Tool Bar and Icons The iView Toolbar and Icons are located within iView and provide the needed functionality to complete patient documentation. Icons in the iView Toolbar will display based on the action that is being performed. For example: If you had just completed documentation an icon in the shape of a checkmark would become active. Click the icon to sign your documentation.
Components of iView I&O 2G iView / I & O 2 G Tool Bar and Icons Collapse Navigator – Hides the navigator to increase the view on the screen. Clicking the button again will restore the navigator window to the original view. Split Window – Allows two views on the screen. It splits the view to the right of the navigator, allowing multiple interactive views at one time. Clicking the button again will remove the screen split. Displays empty columns/rows – Displays all the columns and rows that are have been collapsed because they are empty in the interactive view. Clicking this button again will add all the empty columns and rows. Review Results – Marks all new results visible in the interactive view sections as reviewed. Note: the results with a comment attached to the review request are not reviewed. You must open the document and review it from within the documents viewer window. Sign – Allows you to sign and save documented results and is available only after you have initiated documentation. Cancel – Allows you to cancel the charting session without saving the changes you entered. This button is only available when documentation has been initiated.
iView I&O 2G Bands and Sections The Bands on the iView are displayed and available based on your login and security. Information can be entered directly into fields within the sections and saved to the patient’s chart. Not all Clinicians will be able to view all documentation. While some clinicians may be able to view documentation in selected bands, they may not be able to document in selected sections based on their security. In addition, some clinicians may have several bands while others may only have a few. The order of the bands that are displayed may also differ based on your role and the location of the patient.
iView I&O 2G Bands and Sections The iView Intake and Output Band This band is a record of a patient’s fluid intake and output for a specified time period in one hour increments. Clinicians can view the individual resulted amounts of each output or input event. Discrete amounts of each event can be viewed, as well as shift totals and daily totals displayed in a spreadsheet format. *Not available for all users.
iView I&O 2G Bands and Sections iView Band Icons and Functions Various icons will display within the iView allowing additional functionality as well as alerting you of task that may be overdue.
iView I&O 2G Documentation and Results Based on your security, you should be able to determine which bands are necessary for documentation of the patient’s care. Once a section/band contains documentation, it will remain available for future documentation and also for viewing previous documentation.
iView I&O 2G Documentation and Results Click on the section tile within the navigator. Once selected, it will be highlighted within both the Navigator and View area. The sections with a check mark to the left indicate that these sections already have documentation from a previous time and/or date. When you have opened the patient’s chart and reviewed the information available in iView, you should determine which bands are necessary for documentation of the patient’s care.
iView I&O 2G Documentation and Results • Customizing the iView Bands • Once the customize icon is clicked, the window displays options for selection. The options with a check mark in the box display on the spreadsheet. • The options with no check mark can be selected to display by clicking on the appropriate box. • Unchecked items will not appear in iView unless there has been prior documentation completed for those items.
iView I&O 2G Documentation and Results Removing a Section within an iView Band If you have added a section in error or discover the section is not needed, it can be removed. In selected areas, such as the example below right clicking on the question within the section will allow you to remove it. Right clicking on the section will allow you to remove the entire section.
iView I&O 2G Documentation and Results Setting Time Frames to View Documentation The system will automatically default to the last 12 hours. Right click on the blue information bar to change the time frame. If
iView I&O 2G Documentation and Results Date and Time You are now ready to begin your documentation. The charting time will default to the current date and time.
iView I&O 2G Documentation and Results Changing Date and Time You can change the date and time for the entire column. • Right Click on the column to change. • Click on the Insert Date/Time. • You can now change the date and/or the time for the column in the Change Column Date/Time window.
iView I&O 2G Documentation and Results Changing or Modifying Date and Time The date and time can also be changed for an individual cell by right clicking on the cell and selecting Change Date/Time. This will generate a new column displaying your changed date and result.
iView I&O 2G Documentation and Results Establishing Charting Times To complete scheduled documentation you can establish Charting times in increments such as Q1 min, Q1 hr, etc. Also, you can click on Insert Date/Time. The time selected will display across the top of your flow sheet for the selected section.
iView I&O 2G Documentation and Results Customizing the iView Bands The bands within each section can be customized to add or remove the sections that are needed to complete patient documentation. Items you customize are items specific to your individual patient. These items can be added throughout the patient’s stay based on need. Once customized they will be available for view and documentation by other users based on their security.
iView I&O 2G Documentation and Results Documenting in a single section: Double click in the section header to activate all the cells within that section. A checkmark will be present on the header bar. Continue to click in the cells in that section and document as needed. You can also right click on a single cell and click on Add Results to enter documentation in a single cell. Not all fields in a section need to be completed.
iView I&O 2G Documentation and Results Documenting in Multiple sections In order to document a group of individual results, the clinician must activate a section or an entire column. To document in multiple sections at once the entire column must be active. Double clicking in the time cell under the date activates all the available cells within that section. A check mark will be present on the header bar of each section and the first chartable field will be selected. Continue to click in the appropriate cells in the sections and document as needed. The example displays the Vital Signs and Pain sections checked and available for documentation.
iView I&O 2G Documentation and Results Documented Results Documentation in iView should be completed by documenting based on the hospital policy of “Charting by Exception”. In other words, if you are documenting and the result you document is “meets acceptable parameters” you do not need to populate the other items unless they need to be provided in the chart.
iView I&O 2G Documentation and Results Documented Results Documented results will display in purple text until signed. Once signed they will display in black on your flowsheet.
iView I&O 2G Documentation and Results Signing/Cancelling Documentation Once you have completed your documentation you can sign your documentation by clicking the check mark on the iView toolbar. Documentation completed by Students will be in an “unauthenticated status” until signed by someone with authority to approve. The Cancel button is also now available. Selecting Cancel will remove any unsigned documentation that you have entered.
Types of iView I&O 2G Documentation Types of Documentation Various types of documentation are available when clicking on the cells within iView I&O 2G. We will discuss these methods of documenting and how they will be completed.
Types of iView I&O 2G Documentation Multi Select Documentation A multi select window will appear on the spreadsheet for certain documentation allowing you to select one or more items when charting. This type of list can be recognized by the open box beside each item. Simply click in the box beside one or more of the options to complete your documentation. Selecting other will allow you to enter a free text entry. Make sure to use the available options and not “other” whenever possible. Other boxes may have a circle in front of them indicating they are single select choices.
Types of iView I&O 2G Documentation Alpha Select An alpha select option will allow you to select one item for documentation. Click once on the item you choose to document in the selected cell. Your result will then appear in the cell.
Types of iView I&O 2G Documentation Numeric A numeric field allows you to place a number or value in the selected field by clicking inside that cell to add a result. The example shows a numeric value added for SpO2. Other numeric value fields include temperature, heart rate, blood pressure, etc.
Types of iView I&O 2G Documentation Free Text An Alpha-numeric field is a free text field that allows you to type anything related to result that has been entered in a selected cell. In several sections such as Respiratory Assessment you will see a Comments field where free text documentation can be entered.
Types of iView I&O 2G Documentation Comments Right click on any cell that contains a result and select ‘Add Comment’ to free text documentation. A window will pop up allowing you to add additional information to any field that you have Resulted. Avoid adding extraneous comments whenever possible as this data is not easily viewed by others who view the patient’s chart and is not data that can be used when running a report to observe trends.
Understanding features of iView Documentation Calculations Calculations are present throughout the iView Band indicated by a small calculator shown to the left of the section name. Depending on the setup of the equation, the system may display a value when other values are documented or create a running total in the field. Hovering over the calculator will display the formula used to populate the field. d
Understanding features of iView Documentation When Right clicking in the field with calculations and selecting iView Calculations, the calculation, value and date/time entered will display. j Equation – the calculation used. Equation using actual values – the value(s) that contributed to the equation is displayed in the equation. Name column – the name of the result that contributed to the calculation. In the example above is blood pressure. Value column – the result for each item that contributed to the calculation. Date and Time Column – the date and time the contributing results were documented. j
Understanding features of iView Documentation The iView Intake and Output 2G flowsheet is a record of a patient’s fluid intake and output for a specified time period, typically a 24 hour day separated into one hour increments. Clinicians can view and record the individual resulted amounts of each output or input event. Accumulated hourly totals, shift totals, daily totals, subtotals, and fluid balance can also be viewed from the Intake and Output band by clicking on the Date Range Information Bar and selecting Today’s Results. s
Interacting with iView I&O 2G By Right Clicking on the Results in the cell you can also perform a variety of functions when those options are available. Available options will be indicated by the dark print. The availability of these options will vary. Functions available from the other bands in iView can be used as you complete and modify your documentation. Functions available for I&O vary from those of the other bands.
Interacting with iView I&O 2G Modifying Modifying results in iView is completed by right clicking on the cell to be modified and then modifying and signing the result.
Interacting with iView I&O 2G Uncharting Uncharting a result in iView is completed by right clicking on the cell to be uncharted. A reason for Uncharting should be added. EX: EID (Error in Documentation)
Interacting with iView I&O 2G Changing the Date and Time of Documentation in a single cell This is completed in iView by right clicking on the cell where the change is to be made. A screen will display where the correct date, time and comment can be entered.
Interacting with iView I&O 2G Changing the Date and Time of Documentation in a single cell continued A new column will display on the spreadsheet displaying the new date and/or time that was indicated. The time column where the result originated will display Date/Time Correction. (Note: You can change the date and time of several items by holding down the control key and then right clicking on the selected items.)
Interacting with iView I&O 2G Flagging and Unflagging Results Results in iView can be flagged with or without comments to indicate that attention needs to be given to the result in that cell. Select Unflag or Unflag with Comments to remove the flag or Flag with Comments. A small flag icon will display beside the flagged results and any comments can be viewed.
Interacting with iView I&O 2G Reference Text Reference Text is displayed as a hyperlink in iView. It can be used as a reference to remind clinicians of policies or procedures associated with documentation. Hover over the hyperlink and select Reference Text to view the related information.
Viewing iView I&O 2G Results Setting the Date Range Bar to View Results Right clicking on the date range bar and selecting the range to view allows clinicians to view results by a particular date, date range, Last 24, 48, 72 hours or Today’s Results. Notice the date range options differ in the Intake and Output band.
Viewing iView I&O 2G Results A check mark beside the section indicates there are results in that section.
Viewing iView I&O 2G Results Viewing Critical, High, Low or Abnormal Results A critical, high, low, abnormal or flagged result can be searched and viewed using the filter at the top of iView window. By clicking in the check mark beside one of these values any result falling within the selected range will populate in the Result view window below the filter. . It may be necessary to drag down the display box to be able to view these results. .
Viewing iView I&O 2G Results Find Item Search The search window can also be used to search for results for a specific item within the band you are viewing by using the drop down menu of available options. .
Viewing iView I&O 2G Results Result Indicator Icons A quick reference to the results indicator legend can be viewed at any time by clicking Options in the Organizer Toolbar and then Show Legend. The Results Indicator Icons will be displayed beside the results in the individual cell.
Complex iView Charting Complex iView Charting In addition to routine flowsheet documentation there are additional features available that will assist in documentation ease and functionality. These include: Dynamic Groups • Conditional Logic • Activity View Functionality