Download

1 / 23
260 likes | 388 Views
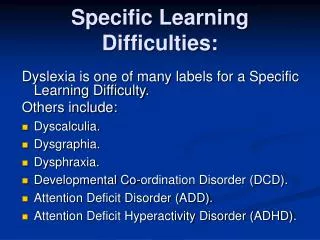
The use of CEM data for teachers of pupils with Specific Learning Difficulties. Intro. How and Why. Baseline Context Predictions Yr 9 Options Motivation Measure individual progress School Review including staff performance. To add a different perspective. O Extreme Outliers

E N D
The use of CEM data for teachers of pupils with Specific Learning Difficulties
How and Why • Baseline • Context • Predictions • Yr 9 Options • Motivation • Measure individual progress • School Review including staff performance
O Extreme Outliers X Outliers
How and Why • Baseline • Context
Diagnostic tests Clinical Evaluation of Language Fundamentals (CELF-4) UK Harcourt Assessment Peabody Picture Vocabulary Test (PPVT) Test of Reception of Grammar Phonological Assessment Battery GL Assessment TROG Pearson Assessment http://www.psychcorp.co.uk/Home.aspx) NFER , Vernon , WRAT4/WRAT E (level 5) WISC IV Pearson Assessment British Ability Scales GL Assessment
How and Why • Baseline • Context • Predictions
How and Why • Baseline • Context • Predictions • Yr 9 Options • Motivation • Measure individual progress
How and Why • Baseline • Context • Predictions • Yr 9 Options • Motivation • Measure individual progress • School Review including staff performance
When? • Beginning of Year 7 and 9 • In work with HODs to review performance & target set • In developing curriculum as part of the development planning cycle • In Leadership meetings post GCSE and at key assessment points
When continued... 5. In our marketing 6. When talking to our stakeholders about the school 7. In Annual Reviews
Practical advice for administering baseline tests Environment Expectations Language Visual demonstrations Timing and sequence