Download
1 / 27
270 likes | 275 Views
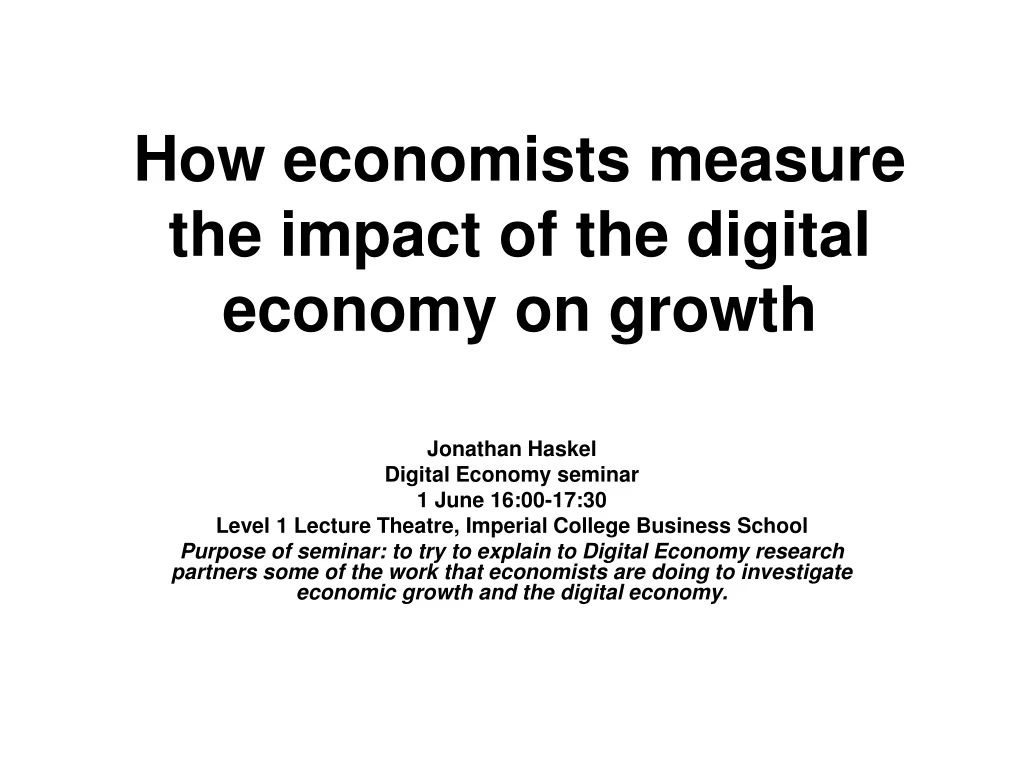
How economists measure the impact of the digital economy on growth. Jonathan Haskel Digital Economy seminar 1 June 16:00-17:30 Level 1 Lecture Theatre, Imperial College Business School

E N D
How economists measure the impact of the digital economy on growth Jonathan Haskel Digital Economy seminar 1 June 16:00-17:30 Level 1 Lecture Theatre, Imperial College Business School Purpose of seminar: to try to explain to Digital Economy research partners some of the work that economists are doing to investigate economic growth and the digital economy.
Research questions • What is the digital economy? • Digitisation refers to new methods of encoding and transmitting information • A technological revolution, since such new methods are better, faster, cheaper, analgous to mechanisation • One related question: what is the impact of ICT on productivty growth? • Many technological revolutions in the past, how does ICT compare? • ICT a general purpose technology • E.g. Industrial revolution, electricity • ICT is • Hardware - usually taken to be computers • Software • Comms equipment –the internet • What are the policy implications of this? • Example: should there be tax breaks for software as there are for R&D? • Should we build more internet capacity? Have more hardware companies? • Other interesting related questions, not looked at here • Analysis of specific ICT/digital companies e.g. how, especially new start ups, grow, finance and organise themselves etc. • Regulation and competition in the digital market place e.g. copyright, net neutrality, mobile phone regulation, standard setting
Why are we interested in growth? • Definition: • economic growth = growth in GDP per persons • Productivity growth = growth in GDP per worker • (relation between the two: workers per person = labour force participation, • Lab force participation related to 1-unemployment rate • Points: • improvements in economic growth raise living standards • Compare developed and developing • Compare economics over time • (But, what about bads from economic growth, pollution etc?) • It turns out that economic growth is driven by productivity growth not participation • The fruits of economic growth in one table: • Higher productivity leads to higher incomes for all (though distribution might change). So higher productivity per worker leads to higher incomes per worker (unless capital incomes rise) • In fact: the average American’s annual income in 2000 was • five times higher than that in 1890 and • 12 times higher than in the 1850s. • One way to see this: the number of hours a worker would have to work to obtain the same items in 1895 versus 2000.
Multiplication of Productivity 1895–2000: Time Needed for an Average Worker to Earn the Purchase Price of Various Commodities • Source: Montgomery Ward catalogue, table in http://www.econlib.org/library/Enc/StandardsofLivingandModernEconomicGrowth.html
Real GDP per hour worked, Europe versus the US, 1870-2000 GDP per hour worked varies relative to per capita GDP catch up Tuesday, May 31, 2011 8
So what is the contribution of ICT/digital to all this? • Hard to see in diagrams, but in US • Post 1995, acceleration in growth • Followed a long ICT computer investment boom, and just when internet was getting connected • Puzzle: no such acceleration in the EU • So need a framework to assess how ICT affects productivity
The sources of growth framework Overall comments 1. So what do we want to measure? • output (GDP = final output. Intermediates make this complicated to measure) • human capital • physical capital (capital services from planes, computers etc) • knowledge capital (capital services from software, business processes etc.) 2. At least some knowledge is embodied in machines. Example of the framework in action: • intensive versus extensive growth. • suppose you added to an economy more and more machines (planes): what would happen to growth?
How do we measure capital services? • Measure “effective” capital stock • Broadly= additions to capital stock = volume of new investment – deprecation • Perpetual inventory model: • K(t)=I(t)+(1-d)K(t-1) • How to measure I = investment? • Consider a pencil economy • We really want the “volume” of pencils in the economy. • In practice statisticians • Do an investment survey: how much are firms spending on pencils? (=Pp*Ip) = value of investment • Do a price survey: how much does the average pencil cost? (=Pp) • Derive “volume” of pencil investment Ip = Pp*Ip/Pp • Computers • Do an investment survey: gives Pc*Ic • But then you need Pc. With rapidly evolving goods, that is not how much the price of the average computer, since the average computer is vastly more powerful, more memory etc. than before. So need to “quality adjust” prices for new computers
What’s been happening to computer prices? • Moore’s law • The number of transistors on a chip doubles every 12-24 months. So “quality adjusted” prices have been falling hugely. Now about 1/250th of level in 2000 • What is the equivalent of such a price fall in the prices of everyday goods? • 1978: a commercial flight between New York and Paris cost $900. If the implied cost fall were applied to the airline industry, cost = 4c. • 1970: price of a new car in 1970 (in 2000 $) was $16,000. prices now: $64.
Output Shares of Information Technology by Type, 1948-2003 Source: Jorgenson Computers Communications Software Total
How to measure effects on output? • Let output come from • capital • Labour • Ideas • Output has risen hugely: how much is from capital, from labour, from ideas? • Assume
Understanding growth • How do we measure the elasticities? • suppose we move from L0 to L1 “units” of labour (say check-in staff/call centres)? How much extra output, Y0 to Y1 do we get out? • Approach 1: engineering • Approach 2: economics • Cost of those extra workers= W*(L1-L0) • Revenue from that extra output so generated = Py*(Y1-Y0) • Assumption: cost-minimisingfirms: • If extra revenue> extra costs, hire more workers • So in equilibrium: Py* (Y1-Y0)= W*(L1-L0) • Thus in equilibrium the extra output is the price ratio times the extra labour: (Y1-Y0) = (W/Py) * (L1-L0) • In % changes (Y1-Y0)/Y0 = (WL0)/PyY0) * (L1-L0)/L0
Implementation • Prices of labour and capital we can see • Price of knowledge? • Some costs: e.g. licence to use software • Some free: = a spillover • e.g. university knowledge, copying others, information on the internet • Some just too hard to measure: e.g. a unit of management consulting • Let’s assume its free..then growth is
Growth when knowledge is free Additional assumption: by construction PYY=WL+PKK. So we can write:
The EU/US puzzle • Why the divergence? Possible answers: • lack of EU co-investment • Structural problems preventing EU services from TFP growth Source: EUKLEMS. EU15 are those for whom data available AUT, BEL, DNK, ESP, FIN, FRA, GER, ITA, NLD & UK.
Research questions • Why US v EU? • Efficiency of service sector, regulation etc. • Measurement • Prices of ICT goods • Better measures of knowledge rather then just free • More information from engineers on efficiency e.g. potential gains in information technology efficiency