Download

1 / 11
120 likes | 262 Views
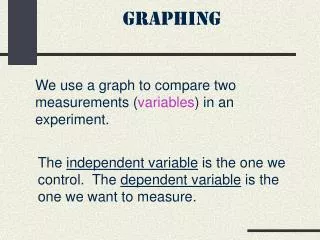
Graphing. The Important Elements of a Graph. Horizontal Axis (X-Axis) Represents the passage of time and the numerical value of behavior. The Independent Variable. Vertical Axis (Y-Axis) Represents the numerical property of the behavior. The Dependent Variable. Title

E N D
The Important Elements of a Graph • Horizontal Axis (X-Axis) • Represents the passage of time and the numerical value of behavior. • The Independent Variable. • Vertical Axis (Y-Axis) • Represents the numerical property of the behavior. • The Dependent Variable. • Title • Should explain the goal of the graph and what it measures. • Scale • The scale of the numbers is important to accurately interpreting the graph.
TYPES OF GRAPHS LINE GRAPH BAR GRAPH PIE CHART SCATTER PLOT
Line Graph • The most common type of graph. • Points connected by a line to make a visual pattern over time. • This pattern is used to evaluate trends.
Bar Graph • Often used when portions of a whole are being represented. • Often used when representing percentage. • Can be useful when the X-axis uses nonconsecutive data points. • Works well to compare information across individuals, settings, or situations.
Pie Chart • Useful in representing portions of a whole. • Useful in representing percentages
Scatter Plot • Used when a variety of measurements are taken consecutively. • Each point is independent. • Can see how one point compares with others.
Graphing Gives the viewer the ability to see trends and analyze data in a different way than simply looking at numbers.