Download
1 / 40
400 likes | 704 Views
Physics and Astrophysics of Supermassive Black Holes July 10 - July 14, 2006 Santa Fe, New Mexico ( Monday, July 10 th , 4:40 pm – 5:00 pm ). (Oscillations) Beats and Rotation of the Accretion Disk around Super massive Black Hole s SgrA*. Makoto Miyoshi ( NAOJ ).

E N D
Physics and Astrophysics of Supermassive Black Holes July 10 - July 14, 2006 Santa Fe, New Mexico (Monday, July 10th,4:40 pm – 5:00 pm) (Oscillations)Beats and Rotation of the Accretion Disk around Super massiveBlack Holes SgrA* Makoto Miyoshi(NAOJ) WithZhi-Qiang Shen, T. Oyama , S. Kameno,H. Nagai, A. Doi , R. Takahashi , Y. Kato, & K. Asada
SgrA* The most convincing Black Hole today from Density Measurement. Precise Mass Measurements M~3.6*106Msun MBH at the Closest Distance ~8kpc The Largest Apparent SchwarzschildRadius Rs ~ 8micro-arcsec Black Hole Shadow will be observed soon at SgrA* (Falcke, Melia et al 00)—Bardeen’s talk --Mueller’s too Quasi Periodic Variation at Flare of IR&X-ray (Genzel03, Eckart06:Aschenbach04) ?Existence of Bright Blob Moving at the Last Stable Orbit ? ?Does the Period mean an Orbital Period? Precise Period Determination is important but difficultbecause the Flare is not so Frequent. Also because the Flare Duration is less than about 3 hours. SgrA* Motions of Stars at GC. NIR Observations (Genzel et al)
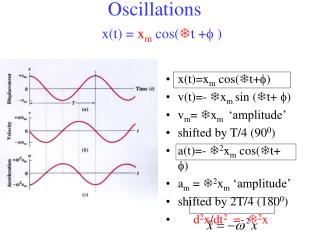
Periodicity was found during NIR flaring of SgrA* P=16.8±2.0 min.(Genzel 03) P=22 min.( Eckart et al 06) Genzel et al. 2003
QPO at X ray too. Periodicity is also found from X ray flare. P~100 s, 219 s, 700 s, 1150 s, and 2250 s were suggested (analysis by Achenbach et al. 2004) –Belanger’s Talk
1. At Radio SgrA* is always bright enough to observe (1Jy at 43GHz). 2. At mm to sub-mm Radio wave also short time flaring are detected (Miyazaki et al. Zhao et al…). --We can expect to detect similar kinds of QPO in radio wave. We checked the data of SgrA* obtained VLBA. We detected the radio QPO from observations at 43GHz taken at 8th March 2004, just 1.5 days after the millimeter wave short time flare. ↑Example of Radio Flaring of SgrA* ( New detection by Miyazaki). 1mas VLBA,86GHz(3.5mm) Shen et al. (2005)
VLBI gives us high spatial resolution(~0.1mas).So we can also investigate the spatial distributions of QPOs in the image of SgrA* if exist. NGC4258 (Herrnstein et al 99, Miyoshi et al 95) A example of investigations of spatial distributions of water maser line in the image.
SgrA* image At 43GHz (VLBA) (whole time integrations) Rectangulars0.1mas(10Rs)×0.15mas(15Rs) We defined 209 rectangular regions and measured time series of flux densities within the regions from 360 snap shot maps with 5 min integrations. 209(=19×11) in all Then we check the spatial distributions of the QPOS. We define these 209 small regions.
s.n.r.7.8 8.67.7 Intensity time Time variations of intensity in the 209 rectangulars ( red line=noise level) 661-05min
Sum up of 209 rectangulars Left (0.1 mas east) Center Right (0.1 mas west) Noiselevel Time variations of flux densities in the central 3 rectangulars, & sum-up
Periods Spectra of the central 3 rectangulars (MEM) peaks 62.2 29.3 19.4 17.0 131.6 55.3 30.2 17.3 12.8 224.8 48.4 23.8 17.7 14.3 Left, 0.1mas-east center Right 0.1mas-west
We show you the statistics of the whole 209 rectangulars Sum-up amplitude of 209 regions Central 3 regions
Statistics on spatial distributions of the periods Strong confinements occur around P=12.9,17.2,30.1, & 55.8 min. (also check at P=22.2min) Sum up 209 rectangulars P=22.2m P=17.2 m P=55.8 m P=12.9 m P=30.1 m Period (min) Distribution size (1sigma) Size=SQRT((X^2+Y^2) X-direction Y-direction Period (min)
We found Periodic Structure Change Patterns with the 4 Periods 1) We searched periodic structure change patterns around the 5 periods. 2) And found characteristic change patterns of the 4 periods. (P=16.8, 22.2, 31.35, &56.35 min.) 3) First, we show you the mapping method for searching periodic structure change patterns in the next slides. P=56.35, 31.35, 16.8min P=22.2 min
Next, with the second phase (=orange) data, make ‘Phase 2’ map.
Only with the third phase (=green) data, make ‘Phase 3’ map.
← wholeobservingtime → ← →oneperiodcircle( P min) ← → sub-divisions (8 phases) → phase 1 map → phase 2 map → phase 3 map → phase 4 map 1) This manner will enhance the periodic structure change pattern in images. 2) Very similar, almost the same uv- coverages – free from the instrumental effect of different synthesized beam shape - → phase 5 map → phase 6 map → phase 7 map → phase 8 map
P=16.80min uv coverage of each phase map phase 1 phase 2 phase 3 phase 4 phase 5 phase 6 phase 7 phase 8
We found Periodic Structure Change Patterns with the 4 Periods P=56.35, 31.35, 16.8min P=22.2 min
Periodic Structure change pattern of the P=56.35 min ① 1 peak ② 2 peaks ③ 2 peaks 2 peaks appear during the half period. ④ 2 peaks ⑤ 2 peaks ⑥ 1 peak 1 peak appears during the other half period. ⑦ 1 peak ⑧ 1 peak
Periodic Structure change pattern of the P=56.35 min ① 1 peak ② 2 peaks This seems as if the central intensity of the period is larger than those of next outer radii. We observe the change with edge-on angle. ③ 2 peaks ④ 2 peaks ⑤ 2 peaks ⑥ 1 peak ⑦ 1 peak ⑧ 1 peak
Periodic Structure change pattern of the P=31.35 min ① 2 peaks ② 1 peak ③ 2 peaks Opposite Opposite ④ 2 peaks ⑤ 1 peak Opposite Opposite ⑥ 2 peaks All Phase maps show different opposite peak number with the corresponding map half periods apart. ⑦ 1 peak ⑧ 1 peak
Periodic Structure change pattern of the P=31.35 min ① 2 peaks This can be explained with 3 bright arms model. We observe the pattern motion from edge-on angle. Far side is unseen. ② 1 peaks Opposite ③ 2 peaks Opposite ④ 2 peaks Opposite ⑤ 1 peak Opposite ⑥ 2 peaks ⑦ 1 peak ⑧ 1 peak
Periodic Structure change pattern of the P=22.2 min Peak is the cross in the figure. Peak position moves along east-west direction with the period. P=22.2min enlarged images along east-west direction This become clearer at P=16.8 min case.
Periodic Structure change pattern of the P=16.8 min P=16.8min ① Peak at right side ② Peak at center side The peak position seems to move with the period. This can be explained with one arm structure pattern rotating with the period. And we observe it from edge-on . ③ Peak at left side ④ Peak at left side ⑤ Peak at left side ⑥ Peak at center ⑦ Peak at right side ⑧ Peak at right side
P=16.80min ←Position shift of the peak
Change Pattern of the P=16.8 min Distribution of Amplitude of the P=16.8min We Fourier-Transformed the Time Series Variations of each Cells in the 8 Phase Maps, derived the Amplitude & Delay Phase of the P=16.8min Change Pattern. Distribution of Phase Delay of the P=16.8min If we cut out at the east-west line….
Three Phase Jumps at the Center • The phase seems delayed outer radius. • But Phase Offset from Center exists. (degree) (Jy) Phase------ Phase connected------ Amplitude---- Radius from the center (mas) P=16.8min
They seem in a resonance. P=16.8, 22.2, 31.35, 56.35min Roughly saying 3:4:6:10 (20:15:10:6 in frequency domain) P=16.8 & 22.2 min; circular change pattern one-arm (?) structure P=31.35 min; three-arms (?) structure. P=56.35 min; confined at the center. The motion changes are too rapid v > c, light velocity The changes are not real motion but pattern changes. These should relate to oscillations of accretion disk! A Example of Disk Oscillation Modes Lense-Thirring Precession of Accretion Disks Draza MarkovicFrederick K. Lamb University of Illinois at Urbana-Champaign http://research.physics.uiuc.edu/CTA/movies/lt/index.html
Line of sight velocitycan be estimated from QPO spectra In real data there are the indications. Intrinsic periodic oscillations occurred at the disk will be Doppler shifted by the rotation velocity in the disk when we observe from outside. A B C A B C Bump moves
P= 62.15min Intensity Maps of the Periods P= 62.15min(upper) P=131.6min(middle) P=224.8min(bottom) The Peak Position Moves From East to West as Periods Become Long. P= 131.6min P= 224.8min Rotation! 1.9mas,(about193Rs)
P= 5- 80min Intensity Maps of rather wideband periods (from the top) P= 5- 80min P= 80-160min P= 160-240min P= 240-320min P= 320-400min ≒const. The Peak Position Moves Towards west as Periods Become long. P= 80-160min P= 160-240min P= 240-320min P= 320-400min If this means the effect of Doppler shift, It must be Rotation! 1.9mas,about 193Rs
↑Displacement of the peak position in P=16.80 min. phase-maps ↑Doppler shift obtained from the tendency of the whole periods (QPO) distributions : <east> blue shifted --------------------------------- red shifted <west> Assuming the structural change pattern of P=16.8min has the same direction of the disk rotation, the above two facts mean that the disk is almost edge-on, tilted the north side towards us about some degrees.
Another View 1 PQPO-1 ∝MBH In Stellar Black Hole 1kHz (103Hz) QPO ; BH mass=1 Msun In Case of SgrA* P=55.3min(3380sec) ー 3×10⁻⁴Hz means MBH=3.4×10⁶Msun! --Almost the same as the precise measurements with IR M~3.6×10⁶Msun -- The Confined P=55.3min QPO of SgrA* should be the similar kind of ‘kHz QPO’
Another View 2 The intrinsic image is obscured and broadened because of scattering effect by circum-nuclear or inter stellar plasma (∝λ2). Shen 他(05), Bower他(04) investigated the effect. Interstellar Plasma Scatters the Radios Image of SgrA* (Scattered Size ∝λobs2). So VLBI Images of SgrA* are Believed to have No Intrinsic Information so far. But our results suggest that the image are NOT TOTALLY OBSCURED. There remain some imprints! VLBI images of the SgrA*(Lo et al. ’99) From GC1998.
Summary of this talk. 1. Radio images of SgrA* has some imprints of intrinsic structure at 43GHz (though scattered and broadened). 2. 4 QPO periods ( P=16.8,22.2, 31.15, & 56.35min) are real variation periods. Clear periodic change patterns seen at these 4 periods. These mean disk oscillations. 3. Using Doppler effected QPO spectra, line of sight velocity can be measured. 4. VLBI SgrA* image is almost edge-on rotating disk. P=56.35, 31.35, 16.8,&22.2min
QPO observations with spatial resolution will reveal the black hole accretions disk. But we need the understanding what is QPO in detail. おしまい That’s all. Thanks!