Download
1 / 26
260 likes | 378 Views
The General Linear Model. Guillaume Flandin Wellcome Trust Centre for Neuroimaging University College London. SPM fMRI Course London, October 2012. Image time-series. Statistical Parametric Map. Design matrix. Spatial filter. Realignment. Smoothing. General Linear Model.

E N D
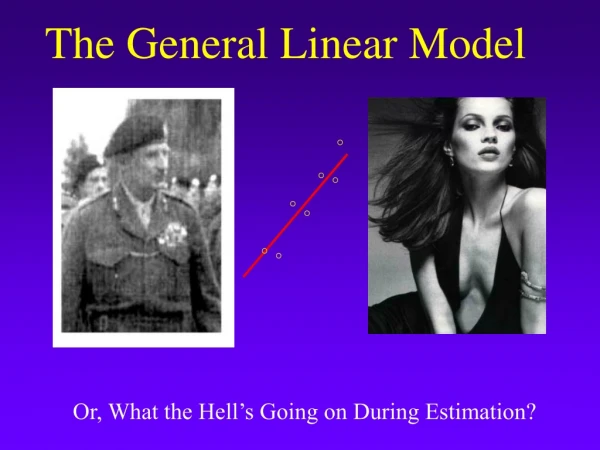
The General Linear Model Guillaume Flandin Wellcome Trust Centre for Neuroimaging University College London SPM fMRI Course London, October 2012
Image time-series Statistical Parametric Map Design matrix Spatial filter Realignment Smoothing General Linear Model StatisticalInference RFT Normalisation p <0.05 Anatomicalreference Parameter estimates
A very simple fMRI experiment One session Passive word listening versus rest 7 cycles of rest and listening Blocks of 6 scans with 7 sec TR Stimulus function Question: Is there a change in the BOLD response between listening and rest?
Model specification Parameter estimation Hypothesis Statistic Voxel-wise time series analysis Time Time BOLD signal single voxel time series SPM
Single voxel regression model error = + + 1 2 Time e x1 x2 BOLD signal
Mass-univariate analysis: voxel-wise GLM X + y = • Model is specified by • Design matrix X • Assumptions about e N: number of scans p: number of regressors The design matrix embodies all available knowledge about experimentally controlled factors and potential confounds.
GLM: a flexible framework for parametric analyses • one sample t-test • two sample t-test • paired t-test • Analysis of Variance (ANOVA) • Analysis of Covariance (ANCoVA) • correlation • linear regression • multiple regression
Parameter estimation Objective: estimate parameters to minimize = + Ordinary least squares estimation (OLS) (assuming i.i.d. error): X y
y e x2 x1 Design space defined by X A geometric perspective on the GLM Smallest errors (shortest error vector) when e is orthogonal to X Ordinary Least Squares (OLS)
Problems of this model with fMRI time series • The BOLD response has a delayed and dispersed shape. • The BOLD signal includes substantial amounts of low-frequency noise (eg due to scanner drift). • Due to breathing, heartbeat & unmodeled neuronal activity, the errors are serially correlated. This violates the assumptions of the noise model in the GLM.
Problem 1: BOLD response Hemodynamic response function (HRF): Scaling Shiftinvariance Linear time-invariant (LTI) system: u(t) x(t) hrf(t) Convolution operator: Additivity Boynton et al, NeuroImage, 2012.
Convolution model of the BOLD response Convolve stimulus function with a canonical hemodynamic response function (HRF): HRF
blue= data black = mean + low-frequency drift green= predicted response, taking into account low-frequency drift red= predicted response, NOT taking into account low-frequency drift Problem 2: Low-frequency noise Solution: High pass filtering discrete cosine transform (DCT) set
Problem 3: Serial correlations i.i.d: autocovariance function
Multiple covariance components enhanced noise model at voxel i error covariance components Q and hyperparameters V Q2 Q1 1 + 2 = Estimation of hyperparameters with ReML (Restricted Maximum Likelihood).
Weighted Least Squares (WLS) Let Then WLS equivalent to OLS on whitened data and design where
Summary A mass-univariate approach Time
Summary Estimation of the parameters noise assumptions: WLS: = =
References • Statistical parametric maps in functional imaging: a general linear approach, K.J. Friston et al, Human Brain Mapping, 1995. • Analysis of fMRI time-series revisited – again, K.J. Worsley and K.J. Friston, NeuroImage, 1995. • The general linear model and fMRI: Does love last forever?, J.-B. Poline and M. Brett, NeuroImage, 2012. • Linear systems analysis of the fMRI signal, G.M. Boynton et al, NeuroImage, 2012.
Contrasts &statistical parametric maps c = 1 0 0 0 0 0 0 0 0 0 0 Q: activation during listening ? Null hypothesis:
Modelling the measured data Make inferences about effects of interest Why? • Decompose data into effects and error • Form statistic using estimates of effects and error How? stimulus function effects estimate linear model statistic data error estimate
Summary • Mass univariate approach. • Fit GLMs with design matrix, X, to data at different points in space to estimate local effect sizes, • GLM is a very general approach • Hemodynamic Response Function • High pass filtering • Temporal autocorrelation
Problem 3: Serial correlations with 1st order autoregressive process: AR(1) autocovariance function
High pass filtering discrete cosine transform (DCT) set
Problem 1: BOLD responseSolution: Convolution model Expected BOLD HRF Impulses = expected BOLD response = input function impulse response function (HRF)