Download
1 / 8

E N D
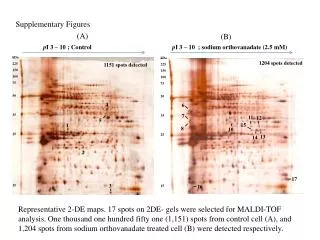
SUPPLEMENTARY FIGURES Supplementary Figure 1. Mapping orthologous poly(A) sites across species. (A) Identification of orthologous poly(A) sites across species. Orthologous poly(A) sites were identified by pair-wise genome alignments. We required reciprocal best matches between two orthologous poly(A) sites according to their distance in the genome alignment, as depicted. a, genomic position for a human poly(A) site; p, the corresponding position for a in another species; b, genomic position of a poly(A) site in another species; q, the corresponding position for b in the human genome. (B) Percent of human poly(A) sites conserved in another species when different window sizes for mapping were used. The window size corresponds to the allowed distance between a and q or p and b in (A). Supplementary Figure 2. Conservation of mouse poly(A) sites in human and rat. (A) Percent of mouse poly(A) sites of different types that are conserved in human and rat. P-values (Chi-squared test) for difference in conservation between F and L types are 1.15x10⁻²⁹ for mouse vs. human, and 6.02x10-39 for mouse vs. rat. Error bars are standard deviation. (B) Conservation of poly(A) site type between mouse and rat orthologous poly(A) sites (p-value < 2.2x10⁻¹⁶, Chi-squared test). Supplementary Figure 3.Poly(A) sites in top TE subfamilies.(A) MER33 subfamily of MER1_type. (B) Tigger1 subfamily of MER2_type. (C) MLT1C subfamily of MaLR21C. (D) MER21C subfamily of ERV1. (E) ORF2 of L1M5 subfamily of L1. (F) 3’ end region of L1ME4a subfamily of L1. (G) 3’ end region of L2a subfamily of L2. (H) MIRb subfamily of MIR. (I) AluSx subfamily of Alu. Each graph shows, from top to bottom, distribution of poly(A) sites on the plus strand, PAS hexamers on the plus strand, poly(A) site prediction of the plus strand, nucleotide composition of the plus strand, poly(A) site prediction of the minus strand, PAS hexamers on the minus strand, distribution of poly(A) sites on the minus strand. Poly(A) sites are indicated by vertical bars and also shown in a profile, which is essentially a smoothed histogram of poly(A) site occurrence. The profile is smoothed by a 11 nt window, i.e. value of a position is the average of 11 nt surrounding the position. Three association types (illustrated in Figure 3C) are represented by different colors, as indicated in the graph. The poly(A) site position for type 1 is actual poly(A) site location, whereas the position for type 2 or 3 is the location of the closest nucleotide in TE to its associated poly(A) site. Additional 40 nt are added to both 5’ and 3’ ends to illustrate poly(A) sites located upstream or downstream of TE. Vertical dotted lines are the start and end of TE. Two types of PAS hexamers are indicated: 1) AATAAA/ATTAAA, and 2) other PAS types that are frequently associated with poly(A) sites, including UAUAAA, AGUAAA, AAGAAA, AAUAUA, AAUACA, CAUAAA, GAUAAA, AAUGAA, UUUAAA, ACUAAA, and AAUAGA. Two poly(A) site prediction results are shown, i.e. PolyA_SVM and polyadq, using their default settings. The nucleotide composition profile is smoothed by a window with the size equal to 15% of the whole sequence.
Supplementary Figure 1 A poly(A) site in the human genome a q Reciprocal best match I I I I I I I I I I I I I I I I I I I p b poly(A) site in the genome of another species B Window size for mapping: 24nt 48nt 96nt 40 35 30 25 Percent of human poly(A) sites conserved in another species (%) 20 15 10 5 0 Mouse Rat Chicken
Supplementary Figure 2 A Mouse vs. Human Mouse vs. Rat 80 65 40 Percent of sites conserved (%) 20 0 S F M L C H Poly(A) site type B 2,000 1,500 1,000 5,00 0 Number of sites L M S F F M L S Mouse Rat
Supplementary Figure 3 A MER33 Sites Site profile (+) AATAAA/ATTAAA Other PAS PAS (+) Prediction (+) PolyA_SVM polyadq Nucleotide composition (+) Prediction (-) PAS (-) Type of Association: Site profile (-) 1 Position (nt): 1 81 162 243 324 2 3 Nucleotide composition: B Tigger1 A T C Site profile (+) G PAS (+) Prediction (+) Nucleotide composition (+) Prediction (-) PAS (-) Site profile (-) Position (nt): 1 605 1,209 1,815 2,418
Supplementary Figure 3 C MLT1C Site profile (+) PAS (+) Prediction (+) Nucleotide composition (+) Prediction (-) PAS (-) Site profile (-) Position (nt): 1 117 234 351 467 D MER21C Site profile (+) PAS (+) Prediction (+) Nucleotide composition (+) Prediction (-) PAS (-) Site profile (-) Position (nt): 1 234 468 702 935
Supplementary Figure 3 E ORF2 of L1M5 Site profile (+) PAS (+) Prediction (+) Nucleotide composition (+) Prediction (-) PAS (-) Site profile (-) Position (nt): 1 824 1,647 2,472 3,294 F 3’ end region of L1ME4a Site profile (+) PAS (+) Prediction (+) Nucleotide composition (+) Prediction (-) PAS (-) Site profile (-) Position (nt): 1 218 436 654 871
Supplementary Figure 3 G 3’ end region of L2a Site profile (+) PAS (+) Prediction (+) Nucleotide composition (+) Prediction (-) PAS (-) Site profile (-) Position (nt): 2,910 3,039 3,169 3,298 3,427 H MIRb Site profile (+) PAS (+) Prediction (+) Nucleotide composition (+) Prediction (-) PAS (-) Site profile (-) Position (nt): 1 67 134 201 268
Supplementary Figure 3 I AluSx Site profile (+) PAS (+) Prediction (+) Nucleotide composition (+) Prediction (-) PAS (-) Site profile (-) Position (nt): 1 78 156 234 312