Download
1 / 52
520 likes | 653 Views
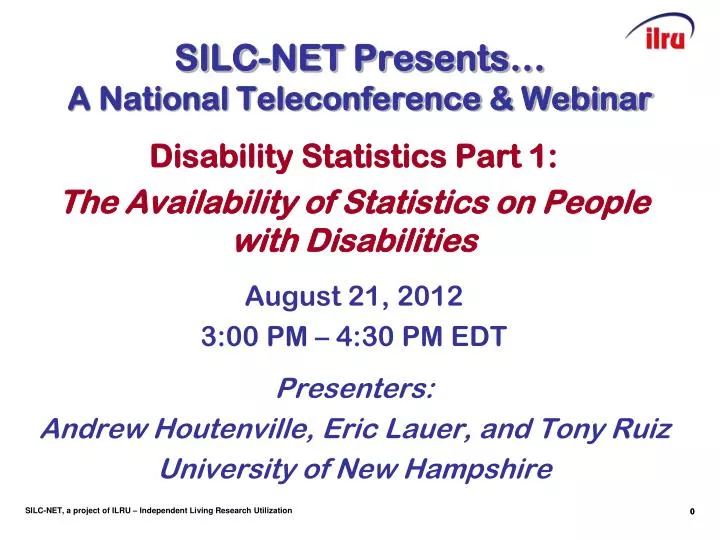
SILC-NET Presents… A National Teleconference & Webinar. Disability Statistics Part 1: The Availability of Statistics on People with Disabilities August 21, 2012 3:00 PM – 4:30 PM EDT Presenters: Andrew Houtenville, Eric Lauer, and Tony Ruiz University of New Hampshire. 0.

E N D
SILC-NET Presents…A National Teleconference & Webinar Disability Statistics Part 1: The Availability of Statistics on People with Disabilities August 21, 2012 3:00 PM – 4:30 PM EDT Presenters: Andrew Houtenville, Eric Lauer, and Tony Ruiz University of New Hampshire 0
SILC-NET Presents…A National Teleconference & Webinar Disability Statistics Part 1: The Availability of Statistics on People with Disabilities August 21, 2012 3:00 PM – 4:30 PM EDT Presenters: Andrew Houtenville, Eric Lauer, and Tony Ruiz University of New Hampshire 1
Introductions • Workshop Presenters (Andrew, Tony, Eric) • UNH Institute on Disability • StatsRRTC • Rehabilitation Research and Training Center on Disability Demographics and Statistics at Hunter College • Funded by National Institute on Disability and Rehabilitation Research (NIDRR) • Webinar Participants • Executive directors, council members, and staff of statewide independent living councils
Impetus for the Workshop • Statistics are valuable in many ways, for example: • They may verify and support existing evidence. • They can provide another way of characterizing an issue. • They can help clarify complex processes. • They sometimes reveal unknown patterns and associations. • However … finding, accessing, using, and documenting statistics and the underlying data is often a frustrating exercise and limits their effectiveness.
Impetus for the Workshop, cont’d. • There needs to be a bridge between the users of statistics and the sources of statistics. • This is particularly true for statistics on the population with disabilities.
Learning Objectives • Explain the nature & importance of disability statistics. • Identify strengths and weaknesses of data and locate agencies or entities that can provide the most appropriate data for particular objectives. • Describe methods for locating and analyzing demographic data. • Develop an effective process for gathering relevant data that relate to goals and priorities. • Use gathered data to assist in developing State Plans for Independent Living.
Learning Objectives, cont’d. • Understand the availability and quality of existing data sources that include information on people with disabilities. • Understand the descriptive statistics compiled from existing data sources available, and know how to access them and utilize them in decision making.
Working 131,727,379 (68.9%) Working Age Population (Ages 18-64) 191,138,268 Not Working 59,410,889 (31.1%) Breakdown of Working Age Population Disability 6,368,644 (4.8%) No Disability 125,358,735 (95.2%) No Disability 46,730,899 (78.7%) Disability 12,679,990 (21.3%) 1,928,750 (21.4%) Hearing 1,995,610 (7.7%) 1,194,184 (13.3%) Vision 2,014,883 (7.7%) 1,855,059 (20.6%) 6,087,943 (23.4%) Cognitive 2,405,715 (26.7%) Ambulatory 7,450,993 (28.6%) 563,110 (6.3%) Self-Care 2,881,092 (11.1%) 1,051,908 (11.7%) Independent Living 5,596,150 (21.5%)
Review of Materials • Workshop Outline • Copy of these PowerPoint Slides • 2011 Annual Disability Statistics Compendium • www.disabilitycompendium.org/pdf/Compendium2011.pdf • Facts & Figures 2011 NH Report on Disability • http://www.iod.unh.edu/pdf/FactsFigures_2011.pdf • CIDNY (NYC ILC) Report • www.cidny.org/resources/News/Reports/Disability%20Matters.pdf • Chicago Community Trust report • www.cct.org/sites/cct.org/files/CCT_QuestForEqualityWhitePaper_1110.pdf
Overview of Jargon and Other Terms • ACS (American Community Survey) • CPS (Current Population Survey) • NHIS (National Health Interview Survey) • SIPP (Survey of Income and Program Participation) • Disability • Population-Based Statistics • Program-Based Statistics • Sampling Error • Measurement Error • User Guides • Disability Statistics Compendium
Identifying and Using Disability Statistics • Give examples how the use of statistics may assist or help you with your work? • Please specify: • The problem or question you have identified • The information you need • Where and how you would search for information • How you would use the information
Example: Identifying and Using Disability Statistics • The problem or question you see • For specific group (e.g. State) what is percentage employed vs. not employed for different disability types. • The information you need • Age groups, disability type, representative data or regional data • Where and how you would search for information • Survey instrument, Web links • How you would use the information • Identify size of population to strengthen argument
Handout - Your turn: Identifying and Using Disability Statistics • What problem issue do you face/question do you have? ________________________________________________________________________________________________ • What information do you need? ________________________________________________________________________________________________ • Where and how you would search for information? ________________________________________________________________________________________________ • How you would use the information? ________________________________________________________________________________________________
Working 2,741,795 (68.9%) Working Age Population (Ages 18-64 in Indiana) 3,982,366 Not Working 1,240,571 (31.1%) Breakdown of Working Age Population in Indiana Disability 140,296 (5.1%) No Disability 2,601,499 (94.9%) No Disability 945,628 (76.2%) Disability 294,943 (23.8%) 47,432 (24.3%) Hearing 49,869 (8.2%) 23,402 (12.0%) Vision 44,249 (7.3%) 40,600 (20.8%) 141,531 (23.2%) Cognitive 51,764 (26.5%) Ambulatory 176,393 (29.0%) 10,795 (5.5%) Self-Care 68,522 (11.2%) 21,133 (10.8%) Independent Living 129,099 (21.2%)
Measuring Disability • What is a disability? To calculate the employment rate, or any other rate, of people with disabilities, we must first define “disability” • Each data set has a different definition of disability and captures different pieces of information about persons with disabilities in the United States, each having strengths and limitations • Pathology-based definitions • Impairment-based definitions • Activity limitation-based definitions • Work limitation-based definition
Definitions of Disability • Medical Model and Social Model • Conceptual Models • Nagi Definition (Nagi, 1965, 1991) • ICF Definition (WHO, 2001) • Legal/Program Definitions • Americans with Disabilities Act Definition • Social Security • Definitions used for the administration of Federal and State Disability Programs (ICDR)
Medical Model • Disability defined in terms of medical problems that must be treated by the medical profession. Usually viewed as disease, illness, abnormality and other medical conditions. • Assumes that disability is an intrinsic characteristic of individuals with disabilities. • Usually results in practices that attempt to cure individuals’ abnormalities and defects, which are seen as strictly personal conditions.
Social Model • Disability viewed as interaction between a person’s health condition and the physical and social environment • The focus is on the contribution of the physical and social environment to disability • Disability is a function of society. Removing barriers reduces impact of health condition on ability to participate in major life activities
Nagi Definition (Nagi, 1965, 1991) • Three major terms • Pathology/Impairment - A physical or mental malfunction or the interruption of a normal process or both / A physiological, anatomical or mental loss or abnormality that limits a person’s capacity and level of function (e.g., glaucoma, tinnitus) • Functional Limitation - Limitation in performance at the level of the person level (e.g., difficulty seeing, difficulty hearing) • Disability - An inability to perform or a limitation in performing socially expected roles or tasks
Nagi Definition (Nagi, 1965, 1991), cont’d. • Work is one socially expected role/task for those of working age • Disability is a dynamic process in which individual pathology and the socioeconomic environment interact • Important: Disability does not include the broader population with disabilities who have a pathology and functional limitations but who have successfully integrated into society
Disability Conceptualization The central point of Nagi conceptualizations of disability is the role of accommodation and environment in converting pathology to impairment to functional limitation to disability. Pathology/Impairment Functional Limitations Disability
International Classification of Functioning, Disability and Health (ICF) Definition (WHO, 2001) • Major Concepts • Impairment. “Problems in body function or structure such as a significant deviation or loss.” • Activity Limitation. “Difficulties an individual may have executing activities.” • Participation Restriction. “Problems an individual may encounter in everyday life situations.” • ICF defines disability as an impairment, activity limitation, and/or participation restriction.
ICF Definition (WHO, 2001), cont’d. • Environmental Factors. ICF recognizes that the physical, social and attitudinal environment can affect disability and has identified important factors. • Important. “Based upon the integration of medical and social models.” Does not limit disability to persons with health conditions who have not integrated into society.
Health Condition Disability Impairment Activity Limitation Participation Restriction ICF Conceptual Model
Policy/Program Definition: Social Security • “Inability to engage in any substantial gainful activity by reason of any medically determinable physical or mental impairment which can be expected to result in death or has lasted or can be expected to last for a continuous period of not less than 12 months.” • Condition must be so severe that a person is unable to perform a minimum level of work. • Approximately 11 million people under the age of 65 collected social security disability benefits in December 2005 based upon this definition, or about 4 percent of population under the age of 65. • Relatively restrictive definition of disability.
Policy/Program Definition: ADA • “A physical or mental impairment that substantially limits one or more of the major life activities, a record of such an impairment, or being regarded as having such an impairment.” • Language in ADA, passed in 1990, states “43,000,000 people in the U. S. have a disability.” Or, about 20 percent of U.S. population. • Relatively broad definition.
Other Policy Program Definitions Workers’ Compensation. “Incapacity because of injury to earn the wages which the employee was receiving at the time of injury in the same or any other employment; but such term shall mean permanent impairment, determined (to the extent covered thereby) under the guides to the evaluation of permanent impairment promulgated and modified from time to time by the American Medical Association, in the case of an individual whose claim is described in section.”
Other Policy Program Definitions, cont’d. VA definition. “Disabled veteran" means an individual who has served on active duty in the armed forces, has been separated there from under honorable conditions, and has established the present existence of a service-connected disability or is receiving compensation, disability retirement benefits, or pension because of a public statute administered by the Department of Veterans Affairs or a military department.
Other Policy Program Definitions, cont’d. 2 • Vocational Rehabilitation (Rehab Act). “A physical or mental impairment that constitutes or results in a substantial impediment to employment; or a physical or mental impairment that substantially limits one or more major life activities.” • For more definitions, see http://www.icdr.us/documents/definitions.htm
How Surveys Identify Disability Concepts • Overview • How do surveys currently measure disability? • Example • Description • Identifying survey questions that are related to a particular definition of disability • Sampling error and non-sampling error • Other measurement issues
Strengths and Limitations of Survey Data • Survey data are the primary source of “population-based” statistics. All other sources are based on administrative records, which only provide information about the program participants. • Samples are designed to be representative of the population. • Sample size can be an issue.
Strengths and Limitations of Survey Data, cont’d. • Survey data are derived from self-reporting and personal interpretation of the questions. • Sometimes proxy responses are used. • Over time survey designers often change the wording of questions or completely redesign the survey instrument.
Example Question: How many people with disabilities are there in the United States and what is the disability definition used?
One possible answer: 54 million (often cited) • Corresponds to a prevalence rate of almost 20 percent. • Based on Census Bureau estimates using the 1994 Survey of Income and Program Participation (SIPP). • http://www.census.gov/sipp/p70s/p70-61.pdf • A “kitchen sink” definition of disability (e.g., one or more ADLs/IADLs; use of a wheelchair, a cane, crutches, or a walker; receipt of federal disability benefits) • Does not include people living in any institution! • UPDATED LAST WEEK --- now 56.7 million! • http://www.census.gov/prod/2012pubs/p70-131.pdf.
Other Possible Answers….. • American Community Survey (ACS) • 34.3 million (or 11.0 percent of) non-institutionalized civilians have a disability in 2010 • Source: www.census.gov– American FactFinder • Current Population Survey (CPS) in July 2011 • 28 million (or 10 percent of) non-institutionalized civilians ages 16 and older • Source: http://www.bls.gov/news.release/empsit.t06.htm
Definitions of Disability in National Datasets • Pathology-Based Definitions • Impairment-Based Definitions • Activity Limitation-Based Definitions • Participation Restriction-Based Definitions
Data Collection Issues • Methods used to collect data can affect results. See Mathiowetz (2000). • Errors of non-observation • Sampling Error, Coverage Error, Non-response error. • Errors of observation • May result from the misinterpretation or failure to comprehend questions in the survey, misreporting on the part of respondents (e.g., recall error), miscommunication of the survey item(s) on the part of the interviewer, and other methods used to administer, collect and process the survey.
Validity, Reliability, and Consistency of the Survey Data • Validity • Content or face validity: Do the data and their context make sense to the educated (or expert) observer? • Reliability • Calculating re-test, and inter-rater comparisons values for sub samples • Internal Consistency • Checking response patterns by verifying that related items in the questionnaire are not contradictory.
Using Disability Statistics: Which dataset and what definition? • What definition of disability should be used? • An impairment-based definition is less likely influenced by changes in the environment and government policy. • Not all persons with impairments report a work limitation. • Our results suggest work limitation questions are useful for measuring trends in the outcomes of people with disabilities. • The CPS has asked a work limitation question since 1981 and contains a tremendous amount of information. • All national data sets are self-reported • Also, some of the disability and/or outcome measures may change over time in each survey -- this needs to be understood.
Contact DisabilityStatistics@unh.edu Andrew.Houtenville@unh.edu Eric.Lauer@unh.edu Tony.Ruiz@unh.edu www.ResearchOnDisability.org/
Wrap Up and Evaluation Click the link below now to complete an evaluation of today’s program found at: https://vovici.com/wsb.dll/s/12291g507cf