Download
1 / 45
450 likes | 540 Views
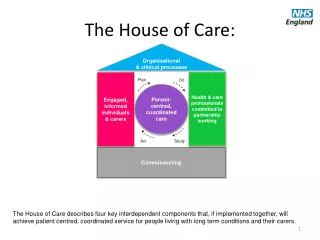
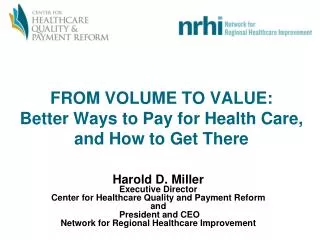
Quality of care – followed by publicly provided care. How to improve quality. Role of malpractice Role of Report Cards and other measures of quality. Reason for Malpractice System.

E N D
How to improve quality • Role of malpractice • Role of Report Cards and other measures of quality
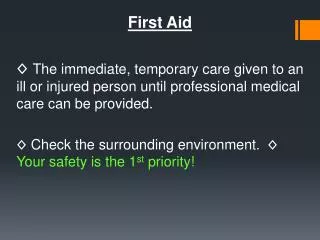
Reason for Malpractice System • Policing – issue of how to insure quality of care. The objective is to create incentives for providers to only provide care for which they are competent and take appropriate care – focus both on process and care. • Compensation – compensate if care fail to meet community standard. • Role based on asymmetric information.
Does system work?Do we know? • For system to operate to send correct signal need case to be brought whenever there is any significant negligence. Amount of remedy must signal correct or full loss. Cost of medical care, cost of lost time, and loss of utility. The last is the justification for payment for pain and suffering. • Similarly for system to work, all unjustified cases must be correctly identified with no payment made. • Signal should be to provider – today we have major role of insurer which weaken system. • Penalty to provider to be involved in case. Loss of time, reputation. • Problem if reduction in those providing certain types of risky care? Ex. Primary provider stop activities re risky pregnancy. (Often desired outcome of system.) • Evidence re defensive medicine? Easier to show did tests, etc. then spent time providing information or asking relevant questions. • In studies of medical accidents fine many more reported than cases ever brought (10 to 1) • Most cases settled out of court (if expectations for outcome similar). Less than 5 % go to trial.
Question for discussion • What modifications of existing malpractice law would improve signals regarding quality of care? • Can you think of any modifications that would reduce defensive medicine? How do you know if we have defensive medicine?
Report Cards and other quality measures: are they beneficial? • Goal –send signal to provider to improve care or drop out of care in particular specialty—improve quality • Danger – provide incentive to not care for the riskiest patients. • Study – New York State heart bypass operations • Find a reduction in volume to hospitals with low ratings • Find an improvement in outcomes for hospitals with low ratings.
Market for nurses - monoponistic • MFC as hospital hires more nurses, need pay more but also to all other nurses; this line is cost of hiring an additional nurse Wage MFC S Vacancies reported W D D Q2 Q1 QN
Public Programs • Reasons for Intervention. • Risk sharing • Equity • Market Failures • Types of Public Programs • Supply Side • Demand side • A Comparison to Other Countries • Our Programs • Medicare • Medicaid • Others • Incentive Effects • Problems
What lies behind a role for government subsidies? • 1. Externalities in consumption • Healthier and wealthier persons in community may not wish to see those less fortunate go without medical caree and are willing to contribute to such care. Their utility depends on this consumption. Then those who contribute benefit but so do those who do not contribute. Government is an efficient way to gather and distribute contributions. • Implication – design of program to satisfy donors rather than recipients. $ MPC MEB MSB MPB Qp Q Q*
What lies behind a role for government subsidies?-2 2.Public health –reduce spread of disease. Improve productivity. • Immunizations • Clean water 3.If person self insures and faces catastrophe, community pays. Not equitable across areas and ability to pay.
Demand side Subsidize insurance via tax system Medicare for elderly and disabled Medicaid for certain low income groups SCHIP for lower income children and in some cases parents Supply side Community health centers VA system Subsidies to educate providers Subsidies to build facilities Types of Public Subsidies
Design • Target program to those with low income and of poor health. If reach high income, inefficient (could achieve at lower cost re taxes, increase in demand for medical care.
The Community Health Center (CHC) Program is a Federal grant program funded under Section 330 of the Public Health Service Act to provide for primary and preventive health care services in medically-underserved areas throughout the U.S. and its territories. The FY 2002 appropriation for this program is $1.3 billion. Program Statistics from the 2000 Uniform Data System (UDS): Total Users - 9.6 M of that 3.9 are uninsured users Total Physicians - 4,803 (19,220,237encounters) Total NPs/PAs - 2,367 (6,657,449 encounters) Total Dentists - 977 (2,606,326 encounters) Total Hygienists - 283 (401,946 encounters)
Community Health Centers (CHCs) were first funded by the Federal Government as part of the War on Poverty in the mid-1960s. • By the early 1970s, about 100 neighborhood health centers had been established under the Economic Opportunity Act (OEO). These centers were designed to provide accessible, affordable personal health care services to low income families. • The Public Health Service began funding neighborhood health centers in 1969. With the phaseout of OEO in the early 1970s the centers supported under this authority were transferred to the Public Health Service. Currently, the CHC Federal grant program is authorized under section 330 of the Health Centers Consolidation Act of 1996. • CHCs provide family-oriented primary and preventive health care services for people living in rural and urban medically underserved communities. CHCs exist in areas where economic, geographic, or cultural barriers limit access to primary health care for a substantial portion of the population; and they tailor services to the needs of the community. • Provide services that include primary and preventive health care, outreach and dental care. • Provide essential ancillary services such as laboratory tests, X-ray, environmental health, and pharmacy services as well as related services such as health education, transportation, translation, and prenatal services. • Provide links to welfare, Medicaid, mental health and substance abuse treatment, WIC, and related services. Provide access to a full range of specialty care services. • CHCs are a catalyst for economic development, generating jobs, assuring the presence of health professionals and facilities in underserved areas, and utilizing local services. In FY 2000, the CHC investment generated over $3 billion in revenues for impoverished underserved communities across the country.
Administered grants to over 700 community-based public and private nonprofit organizations that develop and operate CHCs, and in turn support over 3,000 clinics. Supported CHCs that serve over 11 million people in FY 2000, of whom 66 percent live below the poverty level. CHCs demonstrate cost effective responsiveness, empower underserved communities, reduce infant mortality rates, lower hospital admission rates and length of hospital stays for patients, lower Medicaid patients’ health costs, and provide care for specific conditions that meets or exceeds protocols for the general population. Supported Integrated Services Delivery System grantees to improve the quality and reduce the cost of health care services for underserved, uninsured people. Administered new Facilities and Managed Care loan guarantee programs, as well as a national technical assistance strategy in partnership with the National Association of Community Health Centers and the Primary Care Associations in Massachusetts, North Carolina, Texas, and Illinois.
The Migrant Health Act was enacted in September 1962 by Public Health Law 87-692, which added Section 310 to the Public Health Service Act. The Migrant Health Program (MHP) provides a broad array of medical and support services to migrant and seasonal farmworkers and their families. The Migrant Health Program is currently authorized under Section 330(g) of the Public Health Service Act. The vision of the MHP is the universal accessibility to quality and appropriate health care for our Nation’s Migrant and Seasonal Farmworkers (MSFW) and their families. The MHP provides MSFW and their families’ access to comprehensive, culturally competent, primary care services. Budget, FY 2002 $107 million. Indian Health Service is another example though it is becoming increasingly similar to Medicaid.
Demand Subsidies • Basic reason – externalities in consumption but what is goal? • Minimum to poor; equal financial access? Equal treatment for equal needs? Equal health status? • How achieve each of these? Equal price does not create equal utilization. High income consume more. $ P Dh Q DT QL DM DL Qmin
Medicaid • Joint federal state program- Each state establishes its own eligibility standards, benefits package, payment rates and program administration under broad federal guidelines. As a result, there are essentially 56 different Medicaid programs – one for each state, territory and the District of Columbia. • Begun in 1965 • Financing • The Medicaid program is jointly financed by the states and the federal government. Medicaid is an entitlement program and the federal spending levels are determined by the number of people participating in the program and services provided. Federal funding comes from general revenues. • The federal government contributes between 50 percent and 83 percent of the payments for services provided under each state Medicaid program. The federal matching rate for administrative costs is uniform for all states and is generally 50 percent, although certain • administrative costs receive a higher federal matching rate. • Categorically eligible: • ■ Families who meet states’ Aid to Families with Dependent Children (AFDC) eligibility requirements in effect on July 16, 1996. • ■ Pregnant women and children under age 6 whose family income is at or below 133 % of the Federal poverty level. • ■ Children ages 6 to 19 with family income up to 100% of the Federal poverty level. • ■ Caretakers (relatives or legal guardians who take care of children under age 18 (or 19 if still in high school)). • ■ Supplemental Security Income (SSI) recipients (or, in certain states, aged, blind, and disabled people who meet requirements that are more restrictive than those of the SSI program). • ■ Individuals and couples who are living in medical institutions and who have monthly income up to 300% of the SSI income standard (Federal benefit rate).
Medicaid eligibility - 2 • Medically Needy:■ • The medically needy have too much money (and in some cases resources like savings) to be eligible as categorically needy. If a state has a medically needy program, it must include pregnant women through a 60-day postpartum period, children under age 18, certain newborns for one year, certain protected blind persons and persons required to sign up for their employer’s health plan if it is cost-effective. • States may also include: ■ Children under age 21, 20, 19, or under age 19 who are full-time students. If a state doesn’t want to cover all of these children, it can limit eligibility to reasonable groups of such children. • ■ Caretaker relatives. ■ Aged persons (age 65 and older). ■ Blind persons (blindness is determined using the SSI program standards or state standards). ■ Disabled persons (disability is determined using the SSI program standards or state standards). ■ Persons who would be eligible if not enrolled in a health maintenance organization. • 37 states have medically needy programs: Alaska Hawaii Maine Nebraska Oklahoma Utah Arkansas Illinois Maryland New Hampshire Pennsylvania Vermont California Iowa Massachusetts New Jersey Puerto Rico Virginia Connecticut Kansas Michigan New York Rhode Island Washington Dist. of Columbia Kentucky Minnesota North Carolina Tennessee West Virginia Florida Louisiana Montana North Dakota Texas* Wisconsin Georgia * • Texas' medically needy program covers only the “mandatory" medically needy groups. It does not cover the aged, blind and disabled. 2
Medicaid eligibility-3 • SPECIAL GROUPS ■ Medicare Beneficiaries—Medicaid pays Medicare premiums, deductibles and coinsurance for Qualified Medicare Beneficiaries (QMB)—individuals whose income is at or below 100% of the Federal poverty level and whose resources are at or below the standard allowed under SSI. • There are additional groups for whom Medicare related expenses are paid by Medicaid—Medicare beneficiaries with income greater than 100% but less than 120% of the Federal poverty level and those whose income is at least 120% but less than 135% of the Federal poverty level. • ■ Qualified Working Disabled Individuals—Medicaid can pay Medicare Part A premiums for certain disabled individuals who lose Medicare coverage because of work. These individuals have income below 200% of the Federal poverty level and resources that are no more than twice the standard allowed under SSI. • ■ States may also improve access to employment, training and placement of people with disabilities who want to work through expanded Medicaid eligibility. Eligibility can be extended to working disabled people between ages 16 and 65 who have income and resources greater than that allowed under the SSI program. • States can extend eligibility even more to include working individuals who become ineligible for the group described above because their medical conditions improve. States may require such individuals to share in the cost of their medical care. • There are two additional eligibility groups that states may include under their Medicaid plans: • women who have breast or cervical cancer; • People with tuberculosis (TB) who are uninsured. • Women with breast or cervical cancer receive all plan services; TB patients receive only services related to the treatment of TB.
What is covered under Medicaid? • States are required to offer the following services to those covered under Medicaid: • Inpatient and outpatient hospital services; laboratory and x-ray services, nursing facility services for those over age 21; • home health services, prenatal care; vaccines for children, physician services, family planning services, • rural health clinic services, pediatric and family nurse practitioner services, diagnosis and treatment for • those under age 21, nurse-midwife services, and ambulatory services by federally qualified health centers. • States may also receive matching funds for providing optional services such as drugs, eyeglasses, and inpatient psychiatric care for individuals under age 21 or over 65, diagnostic services, clinic services, transportation services, rehabilitation and physical therapy services, and home and community-based care to certain persons with chronic impairments.
Financial Aspects of Medicaid • The federal government helps states pay the cost of Medicaid services by means of a variable • matching formula which is adjusted annually. This share is known as the Federal Medical Assistance Percentage (FMAP). The FMAP is a matching rate inversely related to a state’s per capita income and can range between 50 to 83 percent. The federal share of administrative costs is 50 percent for all states. • Medicaid operates as a vendor payment program. Within federal guidelines states have broad • discretion in determining payment methodology and rates. States have the option of paying providers directly or paying for Medicaid services through various prepayment arrangements, such as health maintenance organizations (HMOs). Payments must be sufficient to enlist enough providers so that covered services are available at least to the extent that comparable care and services are available to the general population within that geographic area. Providers participating in Medicaid must accept Medicaid payment rates as payment in full, except where nominal cost-sharing charges may be required. States may impose nominal deductibles, coinsurance, or copayments on some Medicaid recipients for certain services. Some, however, must be excluded from cost-sharing: pregnant women, children under age 18, • hospital or nursing-home patients, who are expected to contribute most of their income to the cost of institutional care. In addition, all Medicaid recipients must be exempt from copayments for emergency services and family planning services.
Medicare Beneficiaries: Source of Eligibility and Coverage, 2002 Source of Eligibility Source of Coverage ESRD 0.6% Medicare+Choice & Cost HMOs 13% Disabled 14% Elderly 85% Fee-for-Service 87% Beneficiaries = 40 million Notes: 1) Totals may not sum due to rounding; 2) ESRD refers to beneficiaries under age 65 with End-Stage Renal Disease; 3) the Disabled category refers to beneficiaries under age 65 without ESRD. Source: Elderly, disabled, and ESRD data from CMS’s Office of the Actuary; Medicare+Choice and cost plan data from CMS’s Medicare Managed Care Contract Report, March 2002.
Number of Medicare Beneficiaries The number of people Medicare serves will nearly double by 2030. 76.8 61.0* 45.9 Medicare Enrollment (millions) 39.6* 34.3 28.4* 20.4 * Numbers may not sum due to rounding. Source: CMS, Office of the Actuary.
Medicare Premiums for 2005: Part A: (Hospital Insurance) Premium Most people do not pay a monthly Part A premium because they or a spouse has 40 or more quarters of Medicare-covered employment. The Part A premium is $206.00 for people having 30-39 quarters of Medicare-covered employment. The Part A premium is $375.00 per month for people who are not otherwise eligible for premium-free hospital insurance and have less than 30 quarters of Medicare-covered employment. Part B: (Medical Insurance) Premium $78.20 per month. Medicare Deductible and Coinsurance Amounts for 2005: Part A: (pays for inpatient hospital, skilled nursing facility, and some home health care) For each benefit period Medicare pays all covered costs except the Medicare Part A deductible (2005 = $912) during the first 60 days and coinsurance amounts for hospital stays that last beyond 60 days and no more than 150 days. For each benefit period you pay: A total of $912 for a hospital stay of 1-60 days. $228 per day for days 61-90 of a hospital stay. $456 per day for days 91-150 of a hospital stay (Lifetime Reserve Days). All costs for each day beyond 150 days Skilled Nursing Facility Coinsurance $114.00 per day for days 21 through 100 each benefit period. Part B: (covers Medicare eligible physician services, outpatient hospital services, certain home health services, durable medical equipment) $110.00 per year. (Note: You pay 20% of the Medicare-approved amount for services after you meet the $110.00 deductible.)
National Personal Health Care Expenditures, by Type of Service and Percent Medicare Paid, CY 2000 Total national personal health care spending in CY 2000 was $1.1 trillion;Medicare accounted for 19 percent. $412 Billion Medicare pays 31% $286 Billion Medicare pays 21% 1 $122 Billion Medicare pays 2% $92 Billion Medicare pays 10% $60 Billion Medicare pays 0% $39 Billion Medicare pays 12% $37 Billion Medicare pays 0% $32 Billion Medicare pays 29% $31 Billion Medicare pays 4% $19 Billion Medicare pays 25% 1 Medicare payments are from managed care plans only, since fee-for-service Medicare does not generally cover outpatient prescription drugs. Source: CMS, Office of the Actuary, National Health Statistics Group
Where the Medicare Claims Dollar Went, FY 2001 Total = $236 billion Inpatient Hospital $93 billion Managed Care $42 billion Skilled Nursing $13 billion Hospice $3 billion Home Health $9 billion DME, Supplies, Independent Labs and Other Services 2 $16 billion Hospital Outpatient and Other Outpatient Facilities1 $20 billion Physicians $40 billion 1 Other outpatient facilities include ESRD freestanding dialysis facilities, RHCs, outpatient rehabilitation facilities, and federally qualified health centers. 2 Other services include ambulatory surgical center facility costs and ambulance services. Note: Spending includes benefit dollars only. Data do not sum due to rounding. Source: CMS, Office of the Actuary
Sources of Payment for Medicare Beneficiaries’ Medical Services, 1999 Medicare pays a little more than half of the total cost of beneficiaries’ medical care. Medicaid 12% ($1,103) Medicare 53% ($5,043) Private Insurance 12% ($1,161) Direct Out-of-Pocket* 19% ($1,825) Other Sources 5% ($441) Overall Medical Expenses per Medicare Beneficiary = $9,573 *Beneficiary out-of-pocket spending does not include their payments for Medicare Part B premiums, private insurance premiums, or HMO premiums. Note: Data are for all beneficiaries, both fee-for-service and Medicare+Choice enrollees. Source: CMS, Office of Research, Development, and Information: Data From the Medicare Current Beneficiary Survey (MCBS) 1999 Cost and Use File.
Types of Supplemental Health Insurance Heldby Fee-for-Service Medicare Beneficiaries, 2000 Most beneficiaries using fee-for-service Medicare have private, supplemental health plans. No Supplemental Insurance 15% Medicaid 19% Other 2% Individual Medigap 27% Employer-Sponsored 33% Medigap & Employer-Sponsored Insurance 5% Note: Medicaid (shown above) includes both Qualified Medicare Beneficiaries (QMBs) and Specified Low-Income Medicare Beneficiaries (SLMBs). Source: CMS, Office of Research, Development, and Information: Data From the Medicare Current Beneficiary Survey (MCBS) 2000 Access to Care File.
Why does supplementary insurance matter? $ D MC 20% 0% Q
Elderly Health Spending as a Percentage of Income, 2000 Most elderly households have incomes below $40,000 and spend a high percentageof their income on health care. Percent of Elderly Households by Income Elderly Households’ Health Spending as a Percentage of Income Percent of Elderly Households Percent of Income Spent on Health Income in Thousands Income in Thousands The Elderly Poor Spend a GreaterPortion of Their Income on Health Most Elderly Households Have Incomes Below $40,000 Source: CMS, Office of the Actuary: data from the Bureau of Labor Statistics, Consumer Expenditure Survey, 1999-2000.
Per Capita Total Health Care Expenses, by Payer, for Beneficiaries Living in Long-Term Care Facilities and the Community, 1999 Beneficiaries in assisted living facilities have lower total expenses than those in nursing homes, but higher out-of-pocket costs. 40,442 40,036 32,616 6,366 2 1 Notes: 1) Because a Skilled Nursing Facility stay is a Medicare covered benefit, Medicare covers a large portion of the expenses for beneficiaries in this group. 2) Assisted Living/Retirement Home also includes Domiciliary Care Homes, Board and Care Homes, and Independent Living Units. All of these arrangements offer some level of assistance to the beneficiary. Source: CMS, Office of Research, Development, and Information: Data from the Medicare Current Beneficiary Survey (MCBS) 1999 Cost and Use File.
Provider Reimbursement under Medicare • Medicare Physician Fee Schedule (MPFS). • provides more than 10,000 physician services, • the associated relative value units, • a fee schedule status indicator, and various payment policy indicators needed for payment adjustment (i.e., payment of assistant at surgery, team surgery, bilateral surgery, etc.). • The Medicare physician fee schedule pricing amounts are adjusted to reflect the variation in practice costs from area to area. • A geographic practice cost index (GPCI) has been established for every Medicare payment locality for each of the three components of a procedure's relative value unit (i.e., the RVUs for work, practice expense, and malpractice). The GPCIs are applied in the calculation of a fee schedule payment amount by multiplying the RVU for each component times the GPCI for that component. • Hospitals are paid using DRGs for inpatient care and by another diagnosis or treatment based payment system for outpatient care.
Issues tied to income tested programs such as Medicaid and SCHIP • Stigma? • Incentive effects re maintaining eligibility • Zero one nature of eligibility • Provider willingness to provide services $ MC Qt Q
Inadequacies of Public Programs Difficulties obtaining care: • Medicaid recipients face a number of difficulties obtaining care. They often find that their coverage is limited to a specific provider, usually an HMO, which may or may not have a facility near by; may require changing providers; may not be open when the adults in the family are not working; may have long delays to get an appointment or long waits at the time of the appointment. • Access problems have gotten worse. Some children in a family may be covered while others are not. Recent evidence suggests that welfare reform, which broke the tie between Medicaid and other programs, has reduced the take-up of Medicaid coverage. • The “all or nothing” character of Medicaid, means that persons are either eligible or they are not. If the family income goes up by one dollar, Medicaid eligibility is lost. This “notch effect” creates an incentive to become eligible and stay on Medicaid. The effect is stronger, the less likely women are to receive private insurance at their place of employment, should they work. • Moffitt and Wolfe (1992) found that Medicaid did keep some women on AFDC and out of the labor force, but the impact was likely to be large only for women whose families have high expected medical care expenditures. • This “notch” problem has been reduced somewhat by mandating coverage of poor pregnant women and young children below the 185 percent of the poverty line.
Inadequacies of Public Programs-2 • Medicaid coverage is inequitable. Because it varies by state, the eligibility income level—the income cutoff—varies considerably. States also differ in the service limitations they have imposed. Some states have limits on the number of inpatient days covered; some states require a second opinion for certain surgery; many states have limits on the quantity of any prescription; and a few states have a limit on the number of physician office visits. Thus, a poor single mother with income at 75 percent of the poverty line may receive no coverage in one state, full coverage with few constraints in a second, and have limited benefits covered and difficulty in finding a provider in a third state. • The level of reimbursement is another factor that influences access to quality care. In a study of childbirths, physician-reimbursement policies were found to influence physicians’ choices of treatment modalities so that relatively low reimbursement rates (specifically, Medicaid reimbursement rates) result in reductions in the intensity with which patients under the care of low-reimbursement providers are treated (Gruber et al., 1999). • Disproportion Share Reimbursement may create incentives to care more for those covered than those not covered.
Inadequacies of Public Programs-3 • Medicare reflects coverage in effect in 60s: no outpatient pharmaceutical coverage, No stop-loss coverage: limited coverage of inpatient care (90 days), freedom of choice of providers. • Medicare’s inpatient reimbursement (DRGs which are a weight) creates issues of fairness in terms of formula for reimbursement and creates incentives for hospitals to shift costs to other parts of hospital –outpatient, SNF, rehab unit. Issues re why same service reimbursed at different levels depending on site of care. • Incentives to join Managed care and for Managed Care (HMOs) to offer package – risk adjustment (95% when first established). Increase in enrollment increases awareness of differences in payment generosity and creates pressure to redo formula. HMOs get positive selection but how far can regulators go re reflecting this and still get HMOs to be part of program? Who bears risk? Rural areas with few options of HMOs raises equity issue. Payment rates vary year to year and across nearby counties though since 2000 a blend of national and county rate. Floors set mean disequilibrium re traditional FFS plans. • The Medicare Hospital Insurance program is projected to become insolvent in 2019, and Medicare expenditures are projected to rise rapidly in coming decades as the baby-boom generation retires and health care costs continue to increase.