Download
1 / 21
210 likes | 348 Views
Numerical Modelling of Capillary Transition zones. Geir Terje Eigestad, University of Bergen, Norway Johne Alex Larsen, Norsk Hydro Research Centre, Norway. Acknowledgments. Svein Skjaeveland and coworkers: Stavanger College, Norway I. Aavatsmark, G. Fladmark, M. Espedal:

E N D
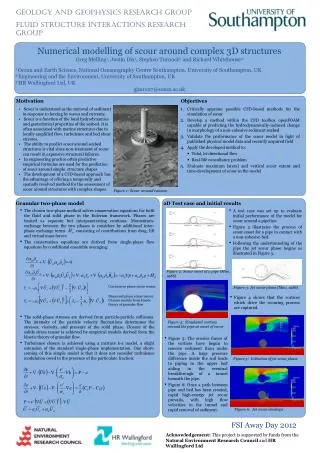
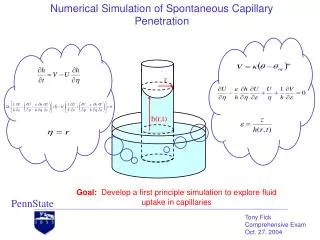
Numerical Modelling of Capillary Transition zones Geir Terje Eigestad, University of Bergen, Norway Johne Alex Larsen, Norsk Hydro Research Centre, Norway
Acknowledgments Svein Skjaeveland and coworkers: Stavanger College, Norway I. Aavatsmark, G. Fladmark, M. Espedal: Norsk Hydro Research Centre/ University of Bergen, Norway
Overview • Capillary transition zone: Both water and oil occupy pore-space due to capillary pressure when fluids are immiscible • Numerical modeling of fluid distribution • Consistent hysteresis logic in flow simulator • Better prediction/understanding of fluid behavior
Skjaeveland’s Hysteresis Model • Mixed-wet reservoir • General capillary pressure correlation • Analytical expressions/power laws • Accounts for history of reservoir • Arbitrary change of direction
Capillary pressure functions • Capillary pressure for water-wet reservoir: • Brooks/Corey: • General expression: water branch + oil branch • c’s and a’s constants; one set for drainage, another for imbibition • Swr[k], Sor[k] adjustable parameters
Hysteresis curve generation • Initial fluid distribution; primary drainage for water-wet system • Imbibition starts from primary drainage curve • Scanning curves • Closed scanning loops Pc Sw
Relative permeability kro krw • Hysteresis curves from primary drainage • Weighted sums of Corey-Burdine expressions • Capillary pressure branches used as weights Sw
Numerical modelling • Domain for simulation discretized • Block center represents some average • Hysteresis logic apply to all grid cells • Fully implicit control-volume formulation:
Numerical issues • Discrete set of non-linear algebraic equations • Use Newtons method • Convergence: Lipschitz cont. derivatives • Assume monotone directions on time intervals • ‘One-sided smoothing’ algorithm
Numerical experiment • Horizontal water bottom drive • Incompressible fluids • Initial fluid distribution; water-wet medium • Initial equilibrium gravity/capillary forces • Given set of hysteresis-curve parameters • Understanding of fluid (re)distribution for different rate regimes
Initial pressure gradients • OWC: Oil water contact • FWL: Free water level • Threshold capillary pressure,
Low rate: saturation distribution • Production close to equilibrium • Steep water-front; water sweeps much oil • Small saturation change to reach equilibrium after shut off
Low rate: capillary pressure • Almost linear relationship cap. pressure-height • Low oil relative permeability in lower part of trans. zone • Curve parameters important for fronts
Medium rate: saturation distribution • Same trends as for lowrate case • Water sweeps less oil in lower part of reservoir • Redistribution after shut- off more apparent
Medium rate: capillary pressure • Deviation from equilibrium • Larger pressure drop in middle of the trans. zone • Front behaviour explained by irreversibility
High rate: saturation distribution • Front moves higher up in reservoir • Less oil swept in flooded part of transition zone • Front behaviour similar to model without capillary pressure
High rate: capillary pressure • Large deviation from equilibrium • Bigger pressure drop near the top of the transition zone • Insignificant effect for saturation in top layer
Comparison to reference solution • Compare to ultra-low rate • Largest deviation near new FWL • Same trends for compressed transition zone Relative deviations from ultra-low rate
Comparison to Killough’s model • Killough’s model in commercial simulator • More capillary smoothing with same input data • Difference in redistribution in upper part • Scanning curves different for the models • Convergence problems in commercial simulator
Conclusions • Skjaeveland’s hysteresis model incorporated in a numerical scheme • ‘Forced’ convergence • Agreement with known solutions • Layered medium to be investigated in future • Extension to 3-phase flow