Download
1 / 21
210 likes | 313 Views
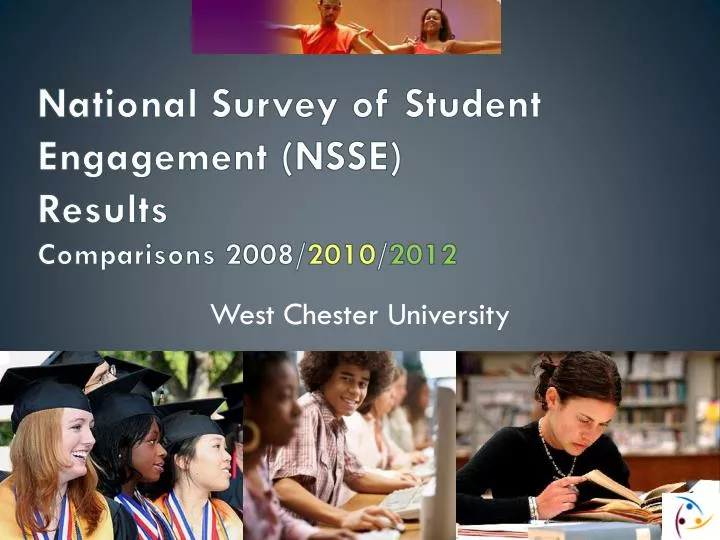
National Survey of Student Engagement (NSSE) Results Comparisons 2008/ 2010 / 2012. West Chester University. What is NSSE and What Does it Measure?.

E N D
National Survey of Student Engagement (NSSE)ResultsComparisons 2008/2010/2012 West Chester University
What is NSSE and What Does it Measure? • A survey that provides an annual snapshot of student engagement in programs and activities that institutions provide for their learning and personal development. • Results provide an estimate of how undergraduates spend their time and what they gain from attending college. • NSSE items represent empirically confirmed “good practices”; they reflect behaviors associated with desired outcomes of college. • 540 First Year • 955 Seniors
NSSE Results • Are diagnostic; to help institutions look holistically at undergraduate experience • Help pinpoint aspects not in line with mission, or what institution expects • Identify weaknesses and strengths in educational programs • Help institutions know what to focus on toimprove student learning and success
NSSE Indicators ofEffective Educational Practice Active & Collaborative Learning Level of Academic Challenge Enriching Educational Experiences Supportive Campus Environment Student – Faculty Interaction
Multi-Year Benchmark Comparison First Year
Multi-Year Benchmark Comparison Seniors
How are doing in preparing our students to work effectively with others? • Worked with classmates outside of class to prepare class assignments (Often/very often) • FY 33% 31% 34% SY 45% 56% 52% • Have worked on a research project with a faculty member outside of course or program requirements • FY 6% 3% 3%SY10% 15% 15% • Worked with faculty members on activities other than coursework (committees, orientation, student life activities, etc.) Those answering Never. • FY 57% 56% 58%SY 47% 41% 45% 2008 /2010 / 2012
Are we teaching students to make connections and think critically? 2008 /2010 / 2012
Study Abroad • Plan to or have studied abroad • Plan to do • FY 37% 34% 33% • Have done • SY6% 8% 8% 2008 /2010 / 2012
Use of Technology 2008 /2010 / 2012
Exercised or participated in physical fitness activities 2008 /2010 / 2012
Supportive Campus Environment • To what extent does WCU help students cope with non-academic responsibilities (work, family, etc.)? • FY 40% 38% 34% • SY 20% 27% 26% • To what extent does WCU provide the support to thrive socially? • FY 52% 50% 52% • SY 32% 38% 38% (Quite a bit or very much) 2008 /2010 / 2012
Quality of Interactions • The quality of relationships with faculty • Helpful, available (4-7) • FY 90% 94%91%SY91% 94% 92% • The quality of relationships with administrative personnel and offices • Helpful, considerate, flexible (4-7) • FY 78% 82% 83%SY 70% 75% 73% • The quality of relationships with other students • Friendly, supportive, sense of belonging (4-7) • FY 93%90%92%SY 90% 93% 93% 2008 /2010 / 2012
To what extent WCU has emphasized the importance of developing a relationship with an academic advisor who can assist you with your academic, degree and career planning? FY 52% SY 42% • Discussed selection of academic majors, minors, or academic concentrations with a faculty or staff member FY 36% SY 35% • Discussed career related topics such as internships, resumes, and references with a career services professional, faculty or other staff member FY 21% SY 44%
Progression toward a degree • Changed your major (at least once) 37%39% • Delayed your graduation plans because courses were not available when needed (at least once) 28%31% 2010 / 2012
How would you evaluate your entire educational experience at this institution? 2008 /2010 / 2012 • Good or Excellent • FY 89% 90% 92% • Senior 84% 90% 86%
If you could start over again, would you go to the same institution you are now attending? Probably Yes FY – 46% / 41% / 38% SY – 41% / 40%/36% Definitely Yes FY – 40% / 45% / 50% SY – 39% / 44% / 47% 2008 /2010 / 2012
Significance of Means and Effect Size • Just because a mean difference is statistically significant doesn’t mean that the result is relevant or important. • Effect size indicates the “practical significance” of the mean difference. • In practice, an effect size of .2 is often considered small, .5 moderate, and .8 large. • A positive sign indicates that WCU’s institution's mean was greater, thus showing an affirmative result for us. • A negative sign indicates we lag behind the comparison group, suggesting that the student behavior or institutional practice represented by the item may warrant attention. • WCU results are very similar to those of other institutions of our type and size. Only one area showed a greater than .2 negative difference: use of technology.