1 / 63

Overview of Experience for Long -term insurers in SA 2005

Overview of Experience for Long -term insurers in SA 2005. Presented to ASSA members 14 November 200 6 – Cape Town 16 November 200 6 – Johannesburg. Why are we here?.

mika
Download Presentation

Overview of Experience for Long -term insurers in SA 2005

An Image/Link below is provided (as is) to download presentation Download Policy: Content on the Website is provided to you AS IS for your information and personal use and may not be sold / licensed / shared on other websites without getting consent from its author. Content is provided to you AS IS for your information and personal use only. Download presentation by click this link. While downloading, if for some reason you are not able to download a presentation, the publisher may have deleted the file from their server. During download, if you can't get a presentation, the file might be deleted by the publisher.

E N D

Presentation Transcript


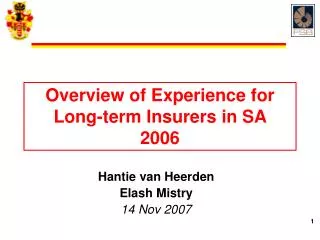
  1. Overview of Experience for Long-term insurers in SA 2005 Presented to ASSA members 14 November 2006 – Cape Town 16 November 2006 – Johannesburg

  2. Why are we here? • To provide information to practicing life actuaries on representative SA Statutory Valuation Method bases reported in 2005.

  3. What will we show you? • Brief overview of the LT Insurance market in 2005. • Review the representative: • Reported AOS results (C7), • Reported valuation assumptions (G10.x) and • Reported actual experience (B - statements) for certain key elements in a valuation basis.

  4. Overview of the LT Insurance market in 2005

  5. Overview - some rankings

  6. Overview - by year-end

  7. Overview - by license

  8. Overview - by business class

  9. Overview - across time

  10. Overview – Spread of CAR cover

  11. Overview – Distribution of CAR

  12. TCAR - Breakdown

  13. OCAR - Breakdown

  14. Overview - key indicators

  15. Overview – PH asset allocation

  16. Overview – SH asset allocation

  17. Overview –assets per industry

  18. Overview - liabilities and CAR 23% ↑ 18% ↑

  19. Overview - AOS

  20. Major Items in AOS

  21. AOS Split

  22. Release of Margins - AOS

  23. Representative valuation basis - Expenses

  24. Expenses - AOS

  25. Expenses – AOSTotal expense loss split 2004 2005 R’000

  26. Expenses – AOSMax and Min per category

  27. Expenses – Expense inflation assumption

  28. Expenses – Actual expense inflation (individual business) 8% 20% 79% 3%

  29. Per policy recurring expense assumption- Individual Business

  30. Initial expense assumptionIndividual business

  31. Actual initial expensesIndividual business per industry

  32. Actual initial expensesIndividual business per class of business

  33. Actual operating expensesIndividual business per industry

  34. Actual operating expensesIndividual business per class of business

  35. Representative valuation basis - Discount rates

  36. Investment return - AOS

  37. Discount rate assumedIndividual business Central discount rate

  38. Real ReturnCumulative Distribution of Assumed Real Return

  39. Investment yield observedIndividual businessInvestment yield observed

  40. Future bonus rates • Vesting • On sum assured • Representative 3% for with-profit business • Little spread for annuities and more for non-annuities • On bonuses • Representative 2% for annuities and 4% for non-annuities • Greater spread for non-annuities • Non-vesting • Representative 5% with greatest spread

  41. Representative valuation basis – Mortality Rates

  42. Mortality – AOS results

  43. Male Assurance Mortality with 1σ confidence intervals

  44. Female Assurance Mortality with 1σ confidence intervals

  45. Assurance Mortality without AIDS loading

  46. Assurance Mortality with AIDS loading

  47. Assurance Mortality AIDS loading

  48. Annuity mortality

  49. Actual : Expected Mortality • For assurance products: • Individual: 79% (79%) actual vs. expected • Group: 93% (97%) actual vs. expected • For annuity products: • Individual: 114% (115%) actual • Group: 93% (88%) actual vs. expected

  50. Representative valuation basis – Morbidity Rates

More Related