Download
1 / 24
250 likes | 464 Views
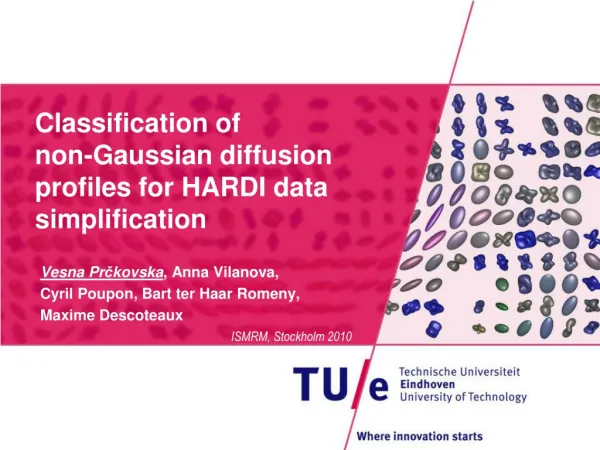
Classification of non-Gaussian diffusion profiles for HARDI data simplification. Vesna Pr č kovska , Anna Vilanova , Cyril Poupon , Bart ter Haar Romeny , Maxime Descoteaux. ISMRM, Stockholm 2010. From measurements to fibers. [Williams et al.]. Background. The mathematical modeling.

E N D
Classification of non-Gaussian diffusion profiles for HARDI data simplification Vesna Prčkovska, Anna Vilanova, Cyril Poupon, Bart terHaarRomeny, MaximeDescoteaux ISMRM, Stockholm 2010
From measurements to fibers [Williams et al.] Background
The mathematical modeling Complex - HARDI Simple - DTI • PDF – Gaussian • Modest acquisitions • Simple model • Limitations in crossing fiber structures • PDF – no assumption • Demanding acquisitions • Complex models • Ability to resolve crossing fiber structures
Complexity of HARDI 3D volume of PDFs or spherical probability functions Hangman et al. • Derived from DW-MRI data • Modeled with high order mathematical descriptors • Spherical Harmonics (SH) • High Order Tensors (HOT) • Represents the local diffusion characteristics of the underlying tissue
Disadvantages of HARDI data Remedy: combine DTI + HARDI + Complex modeling Non-intuitive data representation Long acquisition times (20min – 2h) Long post - processing times (few hours – few days) Problems with memory management Slow and non-interactive visualization
Data representation ADC ODF PDF Forget the HARDI data story for a moment Think of 3D position space of spherical diffusion functions represented by SH: We define measures on SH coefficients
Classification measures • Defined on the SH coefficients • Cumulative residual entropy (CRE) • Number of maxima
Fast classification measures • Simple scalar measures • Most of them calculated on eigenvalues or SH coefficients • Real time • Number of maxima and CRE different category GOAL • Categorize the data in three compartments: • Isotropic • Anisotropic Gaussian (DTI) • Non-Gaussian (HARDI)
Hardware phantom data Constructed at the Atomic Center NeuroSpin, Paris 90° and 45° crossing – challenging angle 4 datasets (b=2000 s/mm2 & b=8000 s/mm2)
Conclusions phantom data The classification power between linear and crossings areas of the HARDI measures is slightly better that the one of the DTI measures For distinguishing isotropic from crossing regions the DTI measures outperform HARDI measures The distribution of the anisotropy values from low to high following the isotropic-crossing-linear pattern, is more noticeable in the HARDI measures like GA, GFA and CRE Combination of different measures for better classification power
Conclusions • Fast classification scheme • Can be applied to different spherical diffusion functions for HARDI and diffusion tensors for DTI • Denoising improves the classification coherence • The simplification of the data has two major advantages: • Post-processing (decrease the time by factor of 5) • Enable interactive and more intuitive visualization of HARDI data
Future work Better algorithm for thresholding the measures Combination of different measures for stronger contrast Introducing new high order measures for voxel classification Comparison of our method to SVM of full Bayesian classifiers (that lack interaction and need learning process)