Download
1 / 21
230 likes | 678 Views
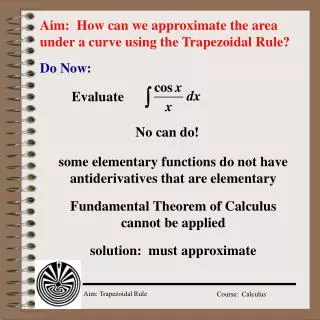
4.2 Area Under a Curve. Sigma (summation) notation REVIEW. In this case k is the index of summation The lower and upper bounds of summation are 1 and 5. In this case i is the index of summation The lower and upper bounds of summation are 1 and 6. Sigma notation.

E N D
Sigma (summation) notation REVIEW In this case k is the index of summation The lower and upper bounds of summation are 1 and 5 In this case i is the index of summation The lower and upper bounds of summation are 1 and 6
Practice with Summation Notation Numerical Problems can be done with the TI83+/84 as was done in PreCalc Algebra Sum is in LIST, MATH Seq is on LIST, OPS
TI-89 Calculator Steps • Hit F3, go down to #4 sum • Enter in the equation • Comma x • Comma lower bound • Comma upper bound • End the parenthesis Try: Answer: 10,950
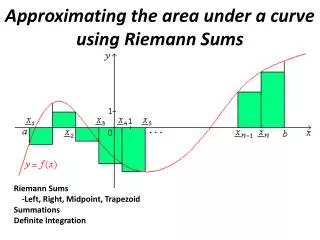
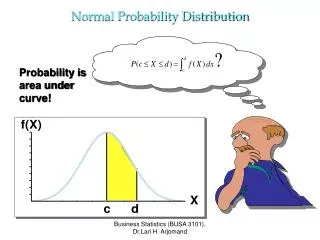
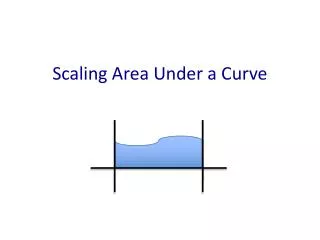
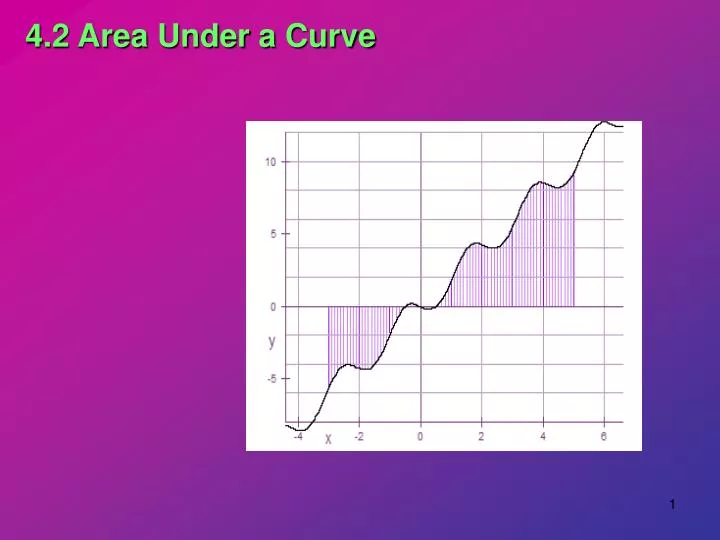
Area Under a Curve by Limit Definition The area under a curve can be approximated by the sum of rectangles. The figure on the left shows inscribed rectangles while the figure on the right shows circumscribed rectangles This gives the lower sum. This gives the upper sum.
Area Under a Curve by Limit Definition If the width of each of n rectangles is x, and the height is the minimum value of f in the rectangle, f(Mi), then the area is the limit of the area of the rectangles as n This gives the lower sum.
Area under a curve by limit definition If the width of each of n rectangles is x, and the height is the maximum value of f in the rectangle, f(mi), then the area is the limit of the area of the rectangles as n This gives the upper sum.
Area under a curve by limit definition The limit as n of the Upper Sum = The limit as n of the Lower Sum = The area under the curve between x = a and x = b.
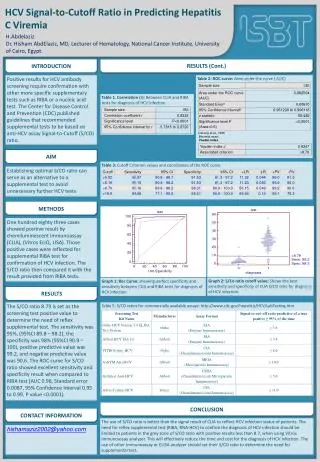
Area under a curve by limit definition ci is any point in the interval Area = f is continuous on [a,b] f(ci) a b ci
Visualization f(ci) ci Width = Δx ith interval
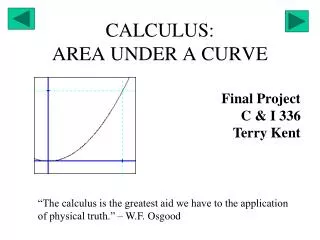
Example: Area under a curve by limit definition Find the area of the region bounded by the graph f(x) = 2x – x3 , the x-axis, and the vertical lines x = 0 and x = 1, as shown in the figure.
Area under a curve by limit definition Why is right, endpoint i/n? Suppose the interval from 0 to 1 is divided into 10 subintervals, the endpoint of the first one is 1/10, endpoint of the second one is 2/10 … so the right endpoint of the ith is i/10.
Visualization again f(ci) ci = i/n Width = Δx= ith interval
Sub for x in f(x) Find the area of the region bounded by the graph f(x) = 2x – x3 on [0, 1] Sum of all the rectangles Right endpoint Use rules of summation
…continued Foil & Simplify
The area of the region bounded by the graph f(x) = 2x – x3 , the x-axis, and the vertical lines x = 0 and x = 1, as shown in the figure = .75 0.75
Practice with Limits Multiply out Separate
4.2 Area Please read the text and go over the examples in the text. Carefully do the assignment making sure you can work out the summation notation. This is an important section though we only have one day to spend on it. Assignment: p 267-269 #1-65 odd