Download
1 / 9
90 likes | 97 Views
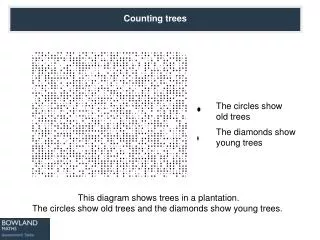
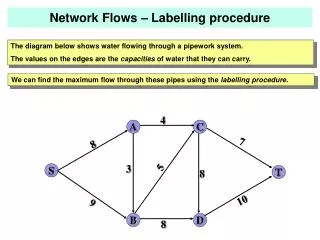
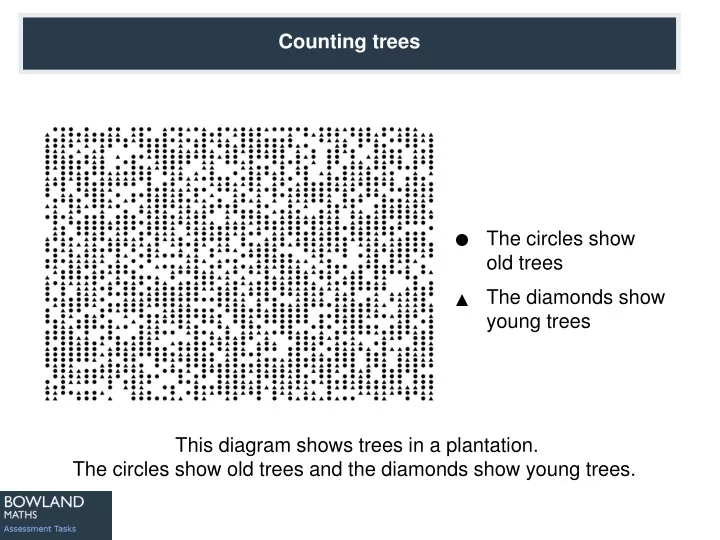
This diagram shows old trees as circles and young trees as diamonds. The National Trust asks Tom to estimate the number of each type of tree. Students are given a method to estimate and asked to evaluate other students' work.

E N D
The circles show old trees The diamonds show young trees This diagram shows trees in a plantation. The circles show old trees and the diamonds show young trees.
The National Trust asks Tom to estimate how many trees there are of each type, but it would take too long for him to count them all, one-by-one. • 1. Think of a method Tom could use to estimate the number of trees of each type. Explain the method fully • 2. Use your method to estimate the number of: • Old trees • Young trees
Follow-up task for students • Look carefully at the following extracts of work from other students. Imagine you are their teacher. Go through each piece of work and write comments on each one. • Have they chosen a sensible method? • Are the calculations correct? • Are the conclusions sensible? • Is the work easy to understand?