Download
1 / 7
70 likes | 140 Views
Electron Arrangement. DP Chemistry R. Slider. Wavelength The actual length of one full wave. Notice: IR > vis > UV. Infrared (IR) Lower energy and higher wavelength than visible light . Ultraviolet (UV) Higher energy and lower wavelength than visible light . Frequency

E N D
Electron Arrangement DP Chemistry R. Slider
Wavelength The actual length of one full wave. Notice: IR > vis > UV Infrared (IR) Lower energy and higher wavelength than visible light Ultraviolet (UV) Higher energy and lower wavelength than visible light Frequency The number of waves passing a particular point every second. Notice: IR < vis < UV Lower Energy higher Visible The range of wavelengths/frequencies that we can see with our eyes Relationships The shorter the wavelength, the greater the frequency and the greater the energy Electromagnetic (EM) Spectrum
Continuous Spectra • Passing a light source through a prism produces a continuous spectrum of colours where all wavelengths are seen • Line Spectra (2 types) • Specific to the substance, this spectrum is produced through the excitation of electrons from the ground state to higher energy levels. • Emission – once excited, the electrons fall back to ground state and emit particular wavelengths of light that correspond to specific energy transitions • Absorption – particular substance will also absorb the same wavelengths that were emitted in the emission spectra. Continuous vs. Line Spectra
This shows the emission spectrum of hydrogen which can be seen using a spectrometer. The UV and IR regions which we cannot see are also represented. Some of the possible e- transitions and their energy levels. The Balmer series show the only visible transitions. The Lyman and Paschen series are also shown. Electron transitions of hydrogen
Each element will have slightly different energy levels and so will be produce a slightly different line spectrum. Therefore, this can be used to determine the makeup of distant stars Line spectra to identify elements
convergence Notice that as we get to higher energy levels, we start to get levels that are closer to one another. This is known as convergence. Above, are the Lyman (UV) transitions. The transitions from the higher energy levels to n=1 converge as the energy of transitions increases. Convergence
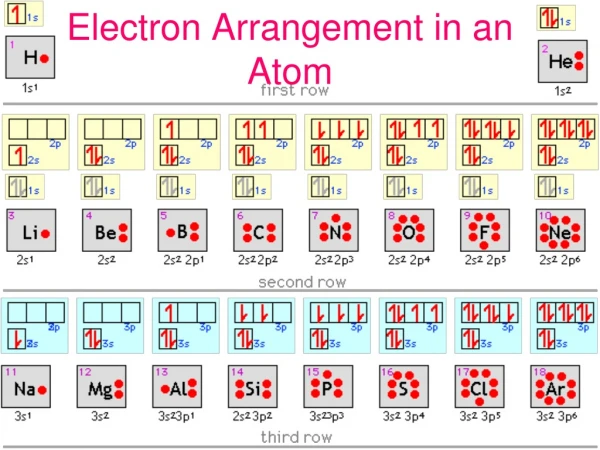
Recall from the introduction of the atom, we discussed the arrangement of electrons (shown in red above). Because there are more electrons as the atomic number increases, the line spectra become increasingly more complex. Electron arrangements