Download
1 / 26
260 likes | 378 Views
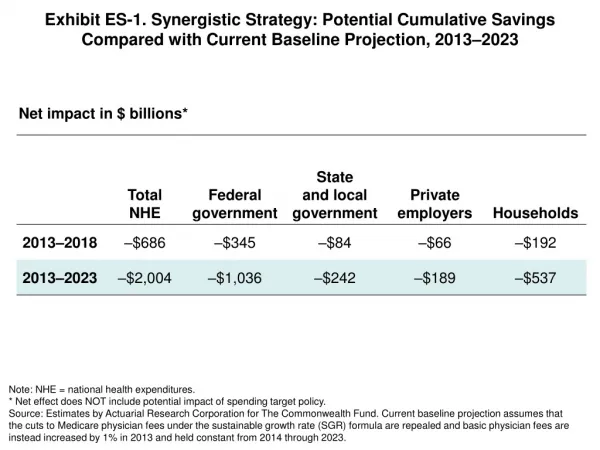
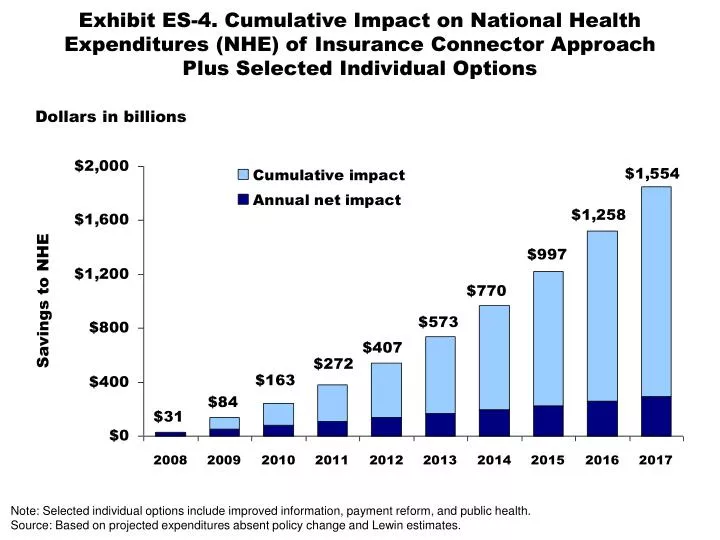
Exhibit ES-4. Cumulative Impact on National Health Expenditures (NHE) of Insurance Connector Approach Plus Selected Individual Options. Dollars in billions. Savings to NHE. Note: Selected individual options include improved information, payment reform, and public health.

E N D
Exhibit ES-4. Cumulative Impact on National Health Expenditures (NHE) of Insurance Connector ApproachPlus Selected Individual Options Dollars in billions Savings to NHE Note: Selected individual options include improved information, payment reform, and public health. Source: Based on projected expenditures absent policy change and Lewin estimates.
Exhibit ES-5. Total National Health Expenditures, 2008–2017 Projected and Various Scenarios Dollars in trillions * Selected individual options include improved information, payment reform, and public health. Source: Based on projected expenditures absent policy change and Lewin estimates.
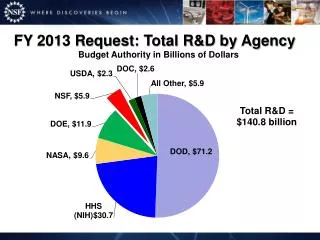
Exhibit 1. Projected National Health Expenditures (NHE)by Payer Source, 2005–2016 * Consumer payments include out-of-pocket payments and private health insurance. Source: J. A. Poisal, C. Truffer, S. Smith et al., “Health Spending Projections Through 2016: Modest Changes Obscure Part D’s Impact,” Health Affairs Web Exclusive (Feb. 21, 2007):w242–w253.
Exhibit 2. International Comparison of Health Spending,1980–2005 Average spending on healthper capita ($US PPP) Total health expenditures as percent of GDP Source: OECD Health Data 2007.
Exhibit 3. Financial Burden for Low- and Middle-Income Families Is Increasing Percent of nonelderly adults spending 10% or more of disposable income on family out-of-pocket medical costs and premiums Note: Financial burden includes out-of-pocket costs for premiums for private insurance and other health services. Source: J. S. Banthin and D. M. Bernard, “Changes in Financial Burdens for Health Care: National Estimates for the Population Younger than 65 Years,” Journal of the American Medical Association, Dec. 13, 2006 296(22):2712–19.
Exhibit 4. One-Third of Adults Ages 19–64 Are Uninsuredor Underinsured, as Are Two-Thirds of Low-Income Adults Percent * Underinsured defined as insured all year but experienced one of the following: medical expenses equaled 10% or more of income; medical expenses equaled 5% or more of incomes if low-income (<200% of poverty); or deductibles equaled 5% or more of income. Data: 2003 Commonwealth Fund Biennial Health Insurance Survey (Schoen et al. 2005b). Source: Commonwealth Fund National Scorecard on U.S. Health System Performance, 2006.
Exhibit 5. Growth in National Health Expenditures (NHE)Under Various Scenarios NHE, in trillions of dollars $4.14 T (19.6% GDP) Cumulative savings projections to 2016: One-time savings of 5%: $1.56 trillion Slowing trend by 1% annually: $1.72 trillion Combination of one-time savings and slowing trend: $3.19 trillion $3.93 T (18.6% GDP) $3.77 T (17.8% GDP) $3.58 T (16.9% GDP) $1.99 Tin 2005 Source: The Commonwealth Fund; data from J. A. Poisal, C. Truffer, S. Smith et al., “Health Spending ProjectionsThrough 2016: Modest Changes Obscure Part D’s Impact,” Health Affairs Web Exclusive (Feb. 21, 2007):w242–w253. 7
Exhibit 8. Distribution of 10-Year Impact on Spendingfrom Promoting Health Information Technology Dollars in billions SAVINGS COSTS Source: Based on estimates by The Lewin Group for The Commonwealth Fund, 2007.
Exhibit 9. Distribution of 10-Year Impact on Spendingfrom Center for Medical Effectivenessand Health Care Decision-Making Dollars in billions SAVINGS COSTS Source: Based on estimates by The Lewin Group for The Commonwealth Fund, 2007.
Exhibit 10. Distribution of 10-Year Impact on Spendingfrom Patient Shared Decision-Making Dollars in billions SAVINGS COSTS Source: Based on estimates by The Lewin Group for The Commonwealth Fund, 2007.
Exhibit 11. Distribution of 10-Year Impact on Spending from Reducing Tobacco Use Dollars in billions SAVINGS COSTS Source: Based on estimates by The Lewin Group for The Commonwealth Fund, 2007.
Exhibit 12. Distribution of 10-Year Impact on Spending from Reducing Obesity Dollars in billions SAVINGS COSTS Source: Based on estimates by The Lewin Group for The Commonwealth Fund, 2007.
Exhibit 13. Distribution of 10-Year Impact on Spendingfrom Positive Incentives for Health Dollars in billions SAVINGS COSTS Source: Based on estimates by The Lewin Group for The Commonwealth Fund, 2007.
Exhibit 14. Distribution of 10-Year Impact on Spendingfrom Hospital Pay-for-Performance Dollars in billions SAVINGS COSTS Source: Based on estimates by The Lewin Group for The Commonwealth Fund, 2007.
Exhibit 15. Distribution of 10-Year Impact on Spendingfrom Episode-of-Care Payment Dollars in billions SAVINGS COSTS Source: Based on estimates by The Lewin Group for The Commonwealth Fund, 2007.
Exhibit 16. Distribution of 10-Year Impact on Spendingfrom Strengthening Primary Care and Care Coordination Dollars in billions SAVINGS COSTS Source: Based on estimates by The Lewin Group for The Commonwealth Fund, 2007.
Exhibit 17. Distribution of 10-Year Impact on Spending from Limit on Federal Tax Exemptions for Premium Contributions Dollars in billions SAVINGS COSTS Source: Based on estimates by The Lewin Group for The Commonwealth Fund, 2007.
Exhibit 18. Distribution of 10-Year Impact on Spendingfrom Reset Benchmark Rates for Medicare Advantage Plans Dollars in billions SAVINGS COSTS Source: Based on estimates by The Lewin Group for The Commonwealth Fund, 2007.
Exhibit 19. Distribution of 10-Year Impact on Spendingfrom Competitive Bidding Dollars in billions SAVINGS COSTS Source: Based on estimates by The Lewin Group for The Commonwealth Fund, 2007.
Exhibit 20. Distribution of 10-Year Impact on Spendingfrom Negotiated Prescription Drug Prices Dollars in billions SAVINGS COSTS Source: Based on estimates by The Lewin Group for The Commonwealth Fund, 2007.
Exhibit 21. Distribution of 10-Year Impact on Spendingfrom All-Payer Provider Payment Methods and Rates Dollars in billions SAVINGS COSTS Source: Based on estimates by The Lewin Group for The Commonwealth Fund, 2007.
Exhibit 22. Distribution of 10-Year Impact on Spendingfrom Limit on Payment Updates in High-Cost Areas Dollars in billions SAVINGS COSTS Source: Based on estimates by The Lewin Group for The Commonwealth Fund, 2007.
Exhibit 23. Cumulative Changes in AnnualNational Health Expenditures, 2000–2007 Percent change 109% 91% 65% 24% Notes: Data on premium increases reflect the cost of health insurance premiums for a family of four/the average premium increase is weighted by covered workers. * 2006 and 2007 private insurance administration and personal health care spending growth rates are projections. Sources: A. Catlin, C. Cowan, S. Heffler et al., “National Health Spending in 2005: The Slowdown Continues,” Health Affairs, Jan./Feb. 2007 26(1):143–53; J. A. Poisal, C. Truffer, S. Smith et al., “Health Spending Projections Through 2016: Modest Changes Obscure Part D’s Impact,” Health Affairs Web Exclusive (Feb. 21, 2007):w242–w253; Henry J. Kaiser Family Foundation/Health Research and Educational Trust, Employer Health Benefits Annual Surveys, 2000–2007 (Washington, D.C.: KFF/HRET).
Exhibit 24. Cumulative Impact on National HealthExpenditures (NHE) of Insurance Connector ApproachPlus Selected Individual Options Dollars in billions Savings to NHE Note: Selected individual options include improved information, payment reform, and public health. Source: Based on projected expenditures absent policy change and Lewin estimates.
Exhibit 25. Net Federal Spending withInsurance Connector Alone Compared with Net Federalwith Insurance Plus Savings Options Dollars in billions $205Insurance Alone $122Insurance Alone $82Insurance Alone * Selected options include improved information, payment reform, and public health. Source: Lewin Group modeling estimates of insurance option alone or insurance in combination with savings optionscompared with projected federal spending under current policies.
Exhibit 26. Total National Health Expenditures, 2008–2017 Projected and Various Scenarios Dollars in trillions * Selected individual options include improved information, payment reform, and public health. Source: Based on projected expenditures absent policy change and Lewin estimates.