Download
1 / 21
210 likes | 314 Views
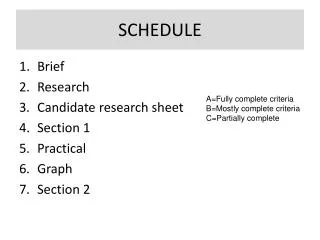
SCHEDULE. Brief Research Candidate research sheet Section 1 Practical Graph Section 2. A=Fully complete criteria B=Mostly complete criteria C=Partially complete. ‘ SWEATING HELPS TO COOL THE BODY’. Lick the back of your hand. Blow gently across your hand.

E N D
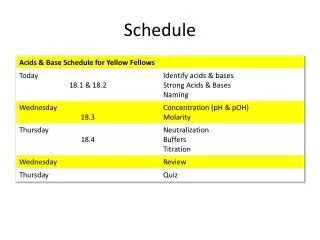
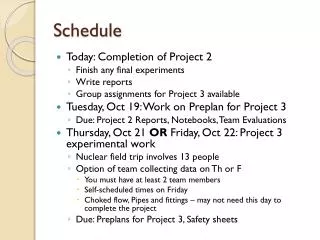
SCHEDULE • Brief • Research • Candidate research sheet • Section 1 • Practical • Graph • Section 2 A=Fully complete criteria B=Mostly complete criteria C=Partially complete
‘SWEATING HELPS TO COOL THE BODY’ • Lick the back of your hand. • Blow gently across your hand. • You should already feel a cooling sensation. • Now, blot your hand dry and use the opposite hand to feel the actual temperature of your skin. • It will actually be cooler to the touch! http://www.youtube.com/watch?v=3JymOF-FADQ
BRIEF “Use a model to investigate a factor that may affect how quickly sweating cools the body” • Brainstorm factors that affect sweating • Choose one factor • Note the context • Make notes on how sweating cools you down using internet and/or books • Make notes on possible models and techniques
CONTEXT The wind affects sweating so there is a problem of over cooling on windy days
Sources • http://www.gcsesciencemethods.co.uk/2013/05/modelling-sweat-colling-effect.html • http://www.sheredes.herts.sch.uk/images/uploads/Investigating_Sweating_Science_mar13.pdf • http://www.markedbyteachers.com/gcse/science/to-measure-heat-loss-in-two-test-tubes-which-represent-bodies-one-which-sweats-the-wet-test-tube-and-one-body-which-doesn-t-sweat-the-dry-test-tube.html Which is best, 1 best because other not because…
RESEARCH A student wanted to record the temperature drop of a cup of tea after 10 minutes. He did this for cups made of china, plastic, polystyrene, tin and paper. Draw a table ready to record his results • Research a technique using 2 sources • Google ‘wind speed & sweating’ • Write the pros and cons of each source • Identify variables • Form a hypothesis • Write a risk assessment • Check your ability to draw tables
SOURCES • Find 2 sources on a possible procedure • Compare the sources • Title & author • Title & web address • State the advantage of one AND the disadvantage of the other
HYPOTHESIS • State your hypothesis • Link the effect of the independent variable on the dependent variable • Explain why this effect happens
METHOD • Identify the equipment/chemicals required • Describe the procedure • List the equipment or draw & label the apparatus set up • Draw a set of instructions for your procedure
VARIABLES • Identify the Independent variable • Identify the Dependent variable • Identify two Control variables • The variable you change (write the RANGE of this) • The variable you discover (write HOW you will measure this) • The variables you will keep the same (write HOW you will do this)
RISKS • Identify two hazards • State HOW you will minimise each risk
TABLE • Draw a table • Use 2 columns-one for the dependent and one for the independent variable • Label with the correct headings & units
Paper 1 Q1 – What is your hypothesis + why? (should be able to identify both variables) Can say read in book … or noticed that… Q2 – Which source was best and why? (whereas) Q3 – Plan + risk assessment Q4 – Why compare? Check results, see if similar pattern – spot anomolies, reproducibility Q5 – Table (headings and units)
GRAPH • Draw a graph • X axis headings, units, scale • Y axis headings, units, scale • Points correctly plotted • Line of best fit correctly drawn
CONCLUSION • Interpret your results • Do your results support your hypothesis? Describe the trend shown by your data. • Describe the patterns shown by your data (quote 2-3 results)
EVALUATION • Evaluate your procedure by identifying a possible error in your procedure • Evaluate your data by identifying the presence/absence of any anomalies • Describe how you would avoid it and explain why this would work. with reasons. • Explain how you know your data has/hasn’t anomalies
SECONDARY DATA TABLES • Draw and label axes • Draw a sketch graph of the above results • At what value of x did y reach its maximum ? • Add this data to your graph • At what value of x did y reach its maximum ? • Does this data support the hypothesis that ‘as x increases, y increases’?
SECONDARY DATA GRAPHS • What does the graph show? x A y C w D B • What does the graph show?
Paper 2 Hints • Do results support hypothesis? Make sure you quote figures from your results and explain pattern • Do you have anomalous results? Say yes or no Refer to pattern Give examples from your data
Paper 2 hints cont 3) Range – Make sure you know your range Say why it is suitable or not by seeing if the pattern is clear. 4) Uncertainties – Think about what was difficult to control and say why it might affect results. 5) Use of models – Say what you think and give reasons for and against.
Cont. 6) Draw a sketch – remember line and names on axis 7) Using case studies Go through each one saying if it supports or not. One will be a red herring! Quote figures 8) Context – explain that if you are sweaty at the end of a race it helps to know that if wind is stronger you will cool quicker. So more likely to get hypothermia.