Download
1 / 35
380 likes | 479 Views
Resilience, Reduction and Responsiveness Some lessons from Millennium Ecosystem Assessment. Jacqueline McGlade European Environment Agency. Globally, environmental pressures are growing in terms of GHG emissions, water and air pollution, land use, resource use and waste

E N D
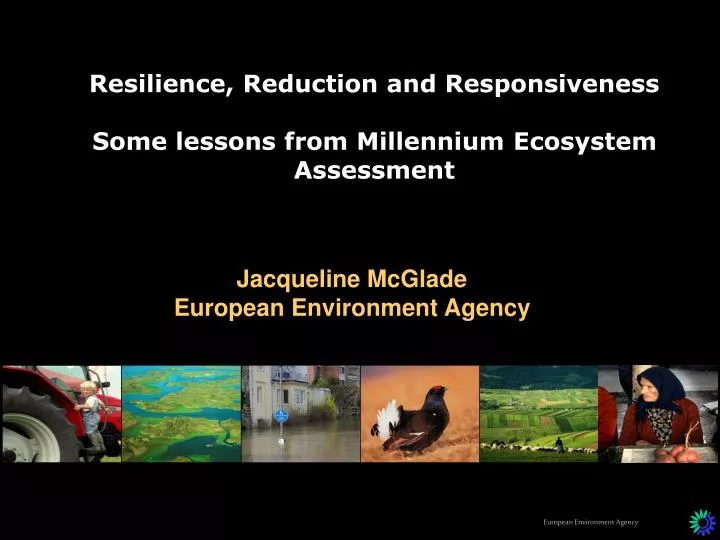
Resilience, Reduction and ResponsivenessSome lessons from Millennium Ecosystem Assessment Jacqueline McGlade European Environment Agency
Globally, environmental pressures are growing in terms of GHG emissions, water and air pollution, land use, resource use and waste In Europe these impacts are still growing across all stages of the production – consumption chain. Without environmental legislation it would have been far worse Social and ecological resilience are now at risk Unsustainable consumption & production patterns
EU-25 use of world biocapacity compared to population share Source: EEA/GFN, 2005: Global ecological overshoot
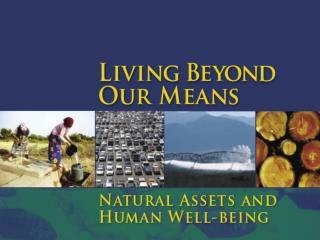
fodder production slope stability tourist attraction recreation water purification biodiversity pollination fibre production food production flood protection carbon sequestration beauty recreation stabilising micro-climate game reserve shelter for lifestock Natural assets
World trade is a driving force Source: WTO, 2003: index = value deflated by unit value.
From empty to full world World economic growth 1990–2001 and links to the use of environmental services (EEA)
Millennium Ecosystem Assessment • Largest assessment ever undertaken of the health of ecosystems • Prepared by 1360 experts from 95 countries; extensive peer review • Consensus of the world’s scientists • Designed to meet needs of decision-makers among government, business, civil society • Information requested through 4 international conventions
Secret of successful assessments • Political Legitimacy • Scientific Credibility • Saliency – Focus on User Needs Intergovernmental Panel on Climate Change (IPCC) Millennium Ecosystem Assessment
Human Well-being Indirect Drivers Ecosystem Services Direct Drivers MA Conceptual Framework • Indirect Drivers of Change • Demographic • Economic (globalization, trade, market and policy framework) • Sociopolitical (governance and institutional framework) • Science and Technology • Cultural and Religious • Human Well-being and • Poverty Reduction • Basic material for a good life • Health • Good Social Relations • Security • Freedom of choice and action • Direct Drivers of Change • Changes in land use • Species introduction or removal • Technology adaptation and use • External inputs (e.g., irrigation) • Resource consumption • Climate change • Natural physical and biological drivers (e.g., volcanoes) Life on Earth: Biodiversity
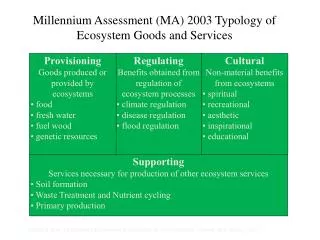
Ecosystem services • Regulating • Benefits obtained from regulation of ecosystem processes • Supporting • Nutrient cycling Soil formation Primary productivity • Provisioning • Goods produced or provided by ecosystems • Cultural • Non-material benefits from ecosystems Photo credits (left to right, top to bottom): Purdue University, WomenAid.org, LSUP, NASA, unknown, CEH Wallingford, unknown, W. Reid, Staffan Widstrand
Main Questions • What is the rate and scale of ecosystem change? • What are the consequences of ecosystem change for the services provided by ecosystems and for human-well being? • How might ecosystems and their services change over the next 50 years? • What options exist to conserve ecosystems and enhance their contributions to human well-being?
Global Assessment Users Regional Development Banks, etc. Regional National Government National Local Community Local Using Multi-Scale Assessments • Rationale • Characteristic scale of processes • Greater resolution at smaller scales • Independent validation of conclusions • Response options matched to the scale where decision-making takes place • Critical elements • Research and monitoring • Assessments methodologies • Signals and Indicators of thresholds and resilience
Sub-Global Assessment Working Group • All of the above… at sub-global scales MA Working Groups • Condition Working Group • What is the current condition and historical trends of ecosystems and their services? • What have been the consequences of changes in ecosystems for human well-being? • Scenario Working Group • Given plausible changes in primary drivers, what will be the consequences for ecosystems, their services, and human well-being? • Responses Working Group • What can we do to enhance well-being and conserve ecosystems?
Synthesis Reports Board Statement MA Conceptual Framework Technical Assessment Volumes
Main Findings • Humans have radically altered ecosystems in last 50 years. • Changes have brought gains but at growing costs that threaten achievement of development goals. • Degradation of ecosystems could grow worse but can be reversed. • Workable solutions will require significant changes in policy
The Balance Sheet Enhanced Degraded Mixed Crops Livestock Aquaculture Carbon sequestration Capture fisheries Wild foods Wood fuel Genetic resources Biochemicals Fresh Water Air quality regulation Regional & local climate regulation Erosion regulation Water purification Pest regulation Pollination Natural Hazard regulation Spiritual & religious Aesthetic values Timber Fiber Water regulation Disease regulation Recreation & ecotourism Bottom Line: 60% of Ecosystem Services are Degraded
The 3 R’s Resilience, Reduction & Responsiveness
10-15% (low certainty) 30-85% Food Demand Water Withdrawal Species Loss MA Scenarios Percent Change by 2050 100 70-85% 50 0
Changing the economic incentives • Problem can’t be solved so long as ecosystem services are treated as free and limitless • Agricultural and fisheries production subsidies cause ecosystem service degradation.
Promising Options • Market mechanisms may sometimes be useful (e.g. potential to reduce nutrient releases and carbon emissions) Ecosystem Marketplace: Online information on ecosystem service markets and payments for services Rapid growth of Carbon market
Private Benefit Capture Difficult Economic Valuation Difficult or impossible Easy Easy Many services are public goods Spiritual & religious ? Aesthetic ? Flood/Fire regulation ? Disease regulation ? Water purification ? Climate regulation ? Freshwater ? Genetic Resources ? Recreation & tourism ? Fiber ? Food ? Economic Value ($)
social & ecological accountability social & ecological sustainability
The Unhappy Planet FoE/NEF 2006 Happiness counts
Need for deliberative decision-making processes • Decision-making could be improved with more information concerning the economic values of different ecosystem services (both marketed and non-marketed) • But, not all ecosystem services that matter to people can be valued in economic terms (esp. cultural services and considerations of intrinsic value) • Moreover, different stakeholders will place different weights on different attributes of ecosystems • Deliberative decision-making processes provide a mechanism to enable these different types of value considerations to be articulated.
Business bottom line • New Opportunities • markets • Carbon market • incentives • payments for ecosystem services • businesses • ecosystem restoration • technologies
Ecosystem Services Audit • Undertake an ‘ecosystem services audit’ • What ecosystem services are used or influenced? • Evaluate risks to those services • Look for cost savings • Assess information needs, expertise needed, and management plans • Evaluate operating environment • Factor into business strategies
World Population (billions) 6.5 billion in 2005 4 billion in 1975 2 billion in 1920 1 billion in 1800 Source: UN Population Division 2004; Lee, 2003; Population Reference Bureau