Download

1 / 30
310 likes | 594 Views
Retrospective Benchmarking, Interpolation, Extrapolation and other applications of temporal disaggregation techniques. Topics…. Some definitions - benchmarking, interpolation, extrapolation Which indicators? Retrospective benchmarking and indicator bias

E N D
Retrospective Benchmarking, Interpolation, Extrapolation and other applications of temporal disaggregation techniques
Topics…. • Some definitions - benchmarking, interpolation, extrapolation • Which indicators? • Retrospective benchmarking and indicator bias • Pro-rata techniques and the ‘step problem’ • Smoothing techniques • Implications for revisions policy • Benchmarking to other variables - linkage • Extrapolation and implications for timeliness • Issues for discussion.
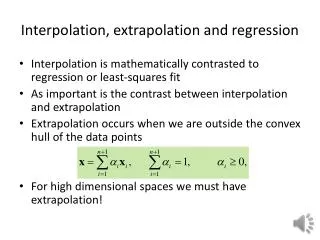
Temporal disaggregation ….is the general term covering : • Interpolation • Retrospective benchmarking and involving a degree of extrapolation. i.e. the disaggregation of less frequent data (quarterly, annual, five yearly) into time series of a higher frequency (weekly, monthly, quarterly)
Interpolation... …... refers to the case where no genuine quarterly/monthly measures exist for a target variable. Thus, annual totals are distributed across quarters/months, where the indicator of quarterly pattern is not a current measure of the same variable. The pattern may be derived from: • previous (discontinued) survey data • proxy variables • as a smooth mathematical function. For example, quarterly estimates of NPISH output are often based on forecast annual data, distributed across the quarters.
...Interpolation It is important not to simply apply seasonal factors to annual totals as this will lead to steps between years. Smoothing and benchmarking techniques must be used. Where a seasonal indicator series is used, it should be pre-adjusted (using seasonal adjustment software) to remove trend and cyclical components
Retrospective Benchmarking …...refers to the case where there are two sources of data for the same target variable, with different frequencies. Benchmarking is concerned with correcting inconsistencies between different estimates of the same variable, i.e. quarterly/monthly estimates and annual estimates BENCHMARK DATA are estimated from more comprehensive data, and so have relatively high accuracy, and a good measure of long-term trend and overall levels. But they are slow to yield results and are expensive INDICATOR DATA are faster and cheaper, but less accurate. They give a reasonable idea of short-term movements and the ‘quarterly/monthly path’, but NOT medium- to long-term trend i.e. the accuracy / timeliness trade-off.
Retrospective Benchmarking Since the coverage of indicators is less complete than the benchmark data (establishments, variables, commodities, industries, geographical areas) …..there are discrepancies between the sum of the indicator data and the annual benchmark values. i.e. the benchmark:indicator ratio, or BI ratio, does not equal 1. The indicator data suffer from BIAS when measuring medium- to long-term trends The size of the bias usually changes from year to year, and can be detected as changes in the BI ratio.
Causes of inconsistencies (lack of congruence) between monthly/quarterly and annual data • sample differences – genuine sampling error • valid differences in imputation methods • differences in grossing (estimation) methods • differences in the treatment of outliers • differences in definitions • calendar year versus accounting year effects • inconsistencies at industry level caused by reclassifications of establishments • timing of register use – different versions of the register • poor estimation by respondents when imputing short-term data versus annual accounting (hence more reliable) data • respondent error.
Retrospective Benchmarking There may be a tension between different aims of annual and monthly/quarterly surveys of the same variable….. …….some inconsistencies may arise because the aim of the annual survey/census is seen to be to obtain the best measure of level, although of course also concerned about measuring annual growth. A monthly/quarterly survey on the other hand may be entirely focussed on measuring short-term growth and thus the effects of all discontinuities (due to reclassifications, etc.) are removed from the time series. A matched model approach may be used.
Retrospective Benchmarking But….assuming, the discrepancies will be removed for publication….. 1. Try to reduce the indicator bias by correcting as many of the causes as possible at source. 2. But remaining discrepancies and bias will have to be corrected by some statistical / mechanical method.
Pro-rata Techniques and the ‘Step Problem’... Pro-rata distribution = distributing annual level data according to how the indicator data is distributed in a single year only, taking no account of neighbouring years But, pro-rata distribution the ‘step’ problem i.e. the growth between Q4 of one year and Q1 of the next will be biased, reflecting the change in BI ratio (pro-rata adjustment) in addition to genuine growth
...Pro-rata Techniques and the ‘Step Problem’... Q to Q % changes (growth rates):
Benchmarking techniques…..………to avoid the step problem Smooth the changes in BI ratios from year to year ... ...whilst... ...maintaining the original quarterly growth rates (quarterly path) as far as possible ... …and ensuring that for each year (assuming all benchmarks are to be binding) i.e. the BI ratios are treated as a quarterly time series (annual steps), which is smoothed
Smoothing Methods…. Smoothing methods aim to produce a series of quarterly BI ratios that change smoothly from one period to the next, whilst averaging to the annual BI ratio for each year. So, all quarterly growth rates will be adjusted by gradually changing but relatively similar amounts. Methods include simple techniques such as a Henderson moving average, and least squares approaches to minimise differences between original data and pro-rata adjusted data
Denton Method... The additive Denton (D1) minimises (least squares) the absolute differences in absolute adjustments to neighbouring quarters subject to the constraints of the benchmarks (binding or non-binding) The proportional Denton (D4) minimises the absolute differences in relative adjustments to neighbouring quarters (better when multiplicative seasonality present). Positive values only (so, pre-adjustment needed) For forwards extrapolation, the BI ratio from the last benchmarked quarter is applied to all new quarterly data, i.e. the BI ratio is projected forwards ‘flat’. But, in the ‘enhanced’ Denton model, the BI ratio is projected forwards (forecast) as rising/falling according to its previous behaviour (error structure)
Other Benchmarking Methods….. Bassie - a stepwise benchmarking method, working on two consecutive years at a time (otherwise steps are introduced). It does not allow extrapolation. General least squares, e.g. BENCH (Statistics Canada) - take account of information about the stochastic properties of the error-generating process (ARMA)
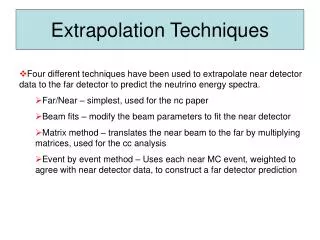
Extrapolation... ….deriving indicator estimates for the most recent periods by moving the indicator series forwards from the last available benchmarked figure, e.g. Q4 2001. In the simple case this involves applying the last available BI ratio, or forecasting the BI ratio, in an attempt to minimise indicator bias in the most recent published estimates. Or….more sophisticated extrapolation involves regressing the indicator data onto the most recent benchmark data Chow-Lin - multiple regression version of additive GLS with binding benchmarks. Several indicators are related to a single benchmark. Not strictly benchmarking, but distribution and extrapolation (ECOTRIM)
Explaining to users…. • For benchmarked (adjusted) data, Q to Q growth rates will differ from those of the source (indicator) data, and new turning points may be introduced • Also, when new annual (year t-1) data become available: • quarters in t-1 are benchmarked • quarters in t-2, t-3 …..are also revised as required by revision of the smoothing function • May decide to have a revision window, e.g. three years.
Coverage and degree of linkage • national accounts • production • business and consumer opinions • CLIs • agriculture, manufacturing and construction • domestic demand • other services • labour market data • prices • finance • foreign trade • BoP
Degree of linkage and revisions So, the question is whether published source data (the results of a monthly retail sales inquiry, index of production, etc.) should be retrospectively benchmarked to align with constant price NA estimates, themselves balanced through a supply-use framework. Arguments against linkage include: - it might be a matter of principle that survey results should reflect what the survey returns are indicating (with any adjustments for known biases) - the earliest source data will be 18 months old when annual NA estimates become available, i.e. 18 month gap between first publication and revision - users of RSI, IoP are only interested in most recent data? If source data are not revised to appear coherent with NA estimates, then publications should include explanations of differences in methods and results.
Benchmarking a monthly IoP Adjustments could be made: 1. on a quarterly basis, as a result of quarterly commodity flow analysis and Q GDP balancing 2. on an annual basis, when annual survey results become available and monthly/quarterly output data are reconciled with annual data 3. on an annual basis, when constant price I:O tables are compiled and I:O ratios are revised
Issues for discussion? • Which meetings/groups have discussed benchmarking in the past? • What is country experience: • coverage • degree of linkage • techniques • revisions - size and policy • users reaction - to benchmarking, and to any lack of alignment • causes of indicator bias • Use of extrapolation techniques for producing faster estimates?
…more issues…. Eurostat Task Force on Benchmarking (!) US / EU : Action 4 - “…benchmarking techniques ….might help to increase coherence, reduce sample sizes…, improve timeliness and foster convergence”. How? Action 5 - …the estimation process could begin with ’expected values’ (regression and/or tendency surveys) ….proceed to ‘observed values’ ….then to ‘preliminary indicators’ ….then to statistical indicators. Relationship with benchmarking?