Download
1 / 13
130 likes | 760 Views
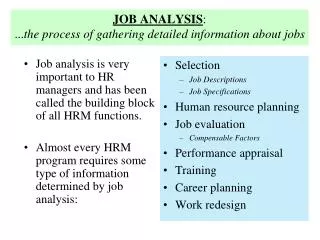
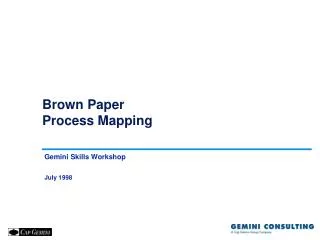
Process Analysis, Kristen’s Cookies & Mapping. Week 2. Today’s Agenda. Continuing with Process Analysis Kristen’s Cookies Case Variability Issues Process Mapping Mapping Team Exercise. KRISTEN’S COOKIES Case. Applying what you’ve learned so far…. Another Example: Quick Service Insurance.

E N D
Today’s Agenda • Continuing with Process Analysis • Kristen’s Cookies Case • Variability Issues • Process Mapping • Mapping Team Exercise
KRISTEN’S COOKIESCase Applying what you’ve learned so far…
Another Example:Quick Service Insurance • Process times per order: Underwriting→ Rating→ Policy Issuing ( 50 min) (60 min) (10 minute)
2 underwriters and 3 Raters Rating underwriting Rating Policy Underwriting Rating Cycle Time? Throughput rate?
5 pm, at 100% capacity (5000 vehicle-miles/hr) Renton to Seattle Tput time: 120 minutes Process time capacity and throughput time
5 pm, at 100% capacity (5000 vehicle-miles/hr) Renton to Seattle Tput time: 120 minutes 5 am, at 10% capacity (500 vehicle-miles/hr) Renton to Seattle min Tput time: 2 minutes Process capacity and Tput time
5 pm, at 100% capacity (5000 vehicle-miles/hr) Bellevue to Seattle cycle time: 120 minutes 5 am, at 10% capacity (500 vehicle-miles/hr) Bellevue to Seattle cycle time: 5 minutes Process capacity and Tput time For constrained processes, Time worsens non-linearly with Capacity Utilization Tput Time Capacity Utilization
2 = 1% Capacity challenge, unevenness, Tput time Mean Tput Time 0 60 110 10 20 30 40 50 70 80 90 100 Mean Capacity Demanded, percent of available
2 = 1% 2 = 5% Capacity challenge, unevenness, Tput time Mean Tput Time 0 60 110 10 20 30 40 50 70 80 90 100 Mean Capacity Demanded, percent of available
2 = 1% 2 = 5% 2 = 10% Mean Tput Time 0 60 110 10 20 30 40 50 70 80 90 100 Mean Capacity Demanded, percent of available Capacity challenge, unevenness, Tput time
Note: • In the Manzana Insurance case for next time, the level of variability at each step should be considered.
Summary • Process Concepts & Terminology • Demonstrations of concepts • Analytical Tools • All ideas will be applied in the Manzana case