Download
1 / 21
210 likes | 411 Views
Obtaining data. Available data are data that were produced in the past for some other purpose but that may help answer a present question inexpensively. The library and the Internet are sources of available data.

E N D
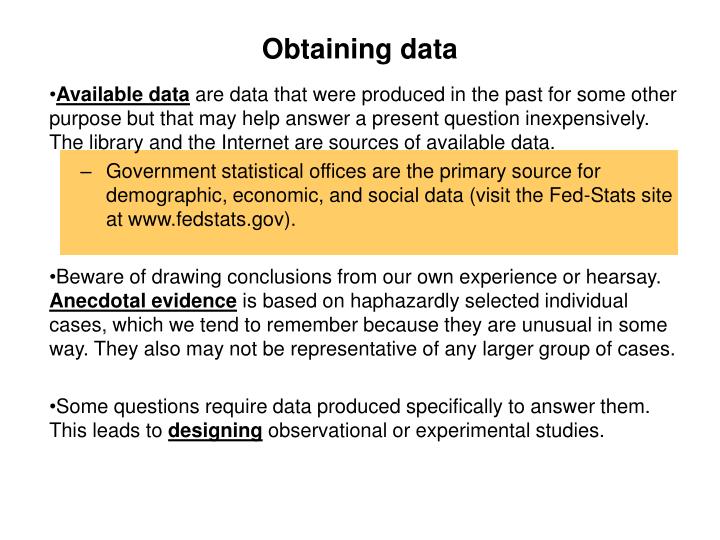
Obtaining data • Available dataare data that were produced in the past for some other purpose but that may help answer a present question inexpensively. The library and the Internet are sources of available data. • Government statistical offices are the primary source for demographic, economic, and social data (visit the Fed-Stats site at www.fedstats.gov). • Beware of drawing conclusions from our own experience or hearsay. Anecdotal evidenceis based on haphazardly selected individual cases, which we tend to remember because they are unusual in some way. They also may not be representative of any larger group of cases. • Some questions require data produced specifically to answer them. This leads to designing observational or experimental studies.
Observational study: Record data on individuals without attempting to influence the responses. We typically cannot prove cause & effect this way. Example: Based on observations you make in nature,you suspect that female crickets choose theirmates on the basis of their health. Observehealth of male crickets that mated. Experimental study: Deliberately impose a treatment on individuals and record their responses. Lurking variables can be controlled. Example: Deliberately infect some males with intestinal parasites and see whether females tend to choose healthy rather than ill males.
a sample is a collection of data drawn from a population, intended to represent the population from which it was drawn – a census is an attempt to sample every individual in the population. • an experiment imposes a so-called treatment on individuals in order to observe their responses. This is in opposition to an observational study which simply observes individuals and measures variables of interest without intervention • go over Examples 3.4-3.6 on p. 176-177 (Chapter 3, Introduction)
Terminology of experiments • The individuals in an experiment are the experimental units. If they are human, we call them subjects. • In an experiment, we do something to the subject and measure the response. The “something” we do (explanatory variable) is a called a treatment, or factor. The values of the factor are called its levels. Sometimes a treatment is a combination of levels of more than one factor. • The factor may be the administration of a drug – the different dosages are its levels. • One group of people may be placed on a diet/exercise program for six months (treatment), and their blood pressure (response variable) would be compared with that of people who did not diet or exercise. Two levels here: on diet, not on diet
Go over example 3.8 on page 179 (3.1, 1/8) and below – an example of a designed experiment with two factors and six treatments. Also see Ex. 3.9, p. 180 (3.1, 2/8) for an example of an experiment not designed well... The lack of a control group causes the problem...
If the experiment involves giving two different doses of a drug, we say that we are testing two levels of the factor. • A response to a treatment is statistically significant if it is larger than you would expect by chance (due to random variation among the subjects). We will learn how to determine this later. • In a study of sickle cell anemia, 150 patients were given the drug hydroxyurea, and 150 were given a placebo (dummy pill). The researchers counted the episodes of pain in each subject. Identify: • The subjects • The factors / treatments • And the response variable • (patients, all 300) • 1 factor, 2 levels (hydroxyurea and placebo) • (episodes of pain)
In principle, experiments can give good evidence for causation through what we call randomized controlled comparative experiments. • The need for comparative experiments is shown in Example 3.9 on p. 180 – a control group is needed so the experimenter can control the effects of outside (lurking) variables • The use of randomization is illustrated in Example 3.10 (3.1, 3/8) – a chance mechanism is used to divide the experimental units into groups to prevent bias.
The logic behind randomized comparative experiments is given on p. 183 (3.1, 4/8): • Randomization produces groups of subjects that should be similar in all respects before the treatments are applied • Comparative design ensures that influences other than the treatment operate equally on all groups • Therefore, differences in the response must be due either to the treatment or to chance in the random assignment of subjects to the groups. • This lead to three basic principles of experimental design on page 183-184…
Control the effects of lurking variables on the response, usually by comparing two or more treatments • Randomize – use a chance mechanism to assign experimental units to treatments. See the Table B of random digits discussed on the later slides… • Repeat each treatment on many units to reduce chance variation in the results • Then if you see differences in the response they are called statistically significant if they would rarely occur by chance
Caution about experimentation The design of a study is biased if it systematically favors certain outcomes. The best way to exclude biases in an experiment is to randomize the design. Both the individuals and treatments are assigned randomly.
Other ways to remove bias: A double-blind experiment is one in which neither the subjects nor the experimenter know which individuals got which treatment until the experiment is completed. The goal is to avoid forms of placebo effects and biases in interpretation. The best way to make sure your conclusions are robust is to replicate your experiment—do it over. Replication ensures that particular results are not due to uncontrolled factors or errors of manipulation.
Fisher found the data from experiments going on for decades to be basically worthless because of poor experimental design. Fertilizer had been applied to a field one year and not in another in order to compare the yield of grain produced in the two years. BUT It may have rained more, or been sunnier, in different years. The seeds used may have differed between years as well. Or fertilizer was applied to one field and not to a nearby field in the same year. BUT The fields might have different soil, water, drainage, and history of previous use. Too many factors affecting the results were “uncontrolled.” Designing “controlled” experiments Sir Ronald Fisher—The “father of statistics” He was sent to Rothamsted Agricultural Station in the United Kingdom to evaluate the success of various fertilizer treatments.
In the same field and same year, apply fertilizer to randomly spaced plots within the field. Analyze plants from similarly treated plots together. This minimizes the effect of variation within the field in drainage and soil composition on yield, as well as controlling for weather. Fisher’s solution: “Randomized comparative experiments”
A Table of Random Digits can be used to Randomize an Experiment • any digit in any position in the table is as equally likely to be 0 as 1 as 2 as … as 9 • the digits in different positions are independent in the sense that the value of one has no influence on the value of any other • any pair of random digits has the same chance of being picked as any other (00, 01, 02, … 99) • any triple of random digits has the same chance of being picked as any other (000, 001, … 999) • and so on…
Now use Table B to randomly divide the 40 students in Ex. 3.10 into the two groups (control group and experimental group) • Step 1: Label the experimental units with as few digits as possible • Step 2: Decide on a protocol for how you will place the chosen units into the groups • Step 3: Start anywhere in the Table and begin reading random digits. Matching them with labeled experimental units and following the protocol creates the groups. • Go over example 3.11 on page 185ff (3.1, 5/8) in detail until you understand!
EX.3.10: We need to randomly divide the 40 students into two groups of 20-the cell phone talking while driving and the driving group only. • List and number (label) all available subjects (the group of 40). • Decide that the first 20 students chosen go to the experimental group; the remainder to the control group (this is the protocol) • Scan Table B in groups of numbers that are two digits long. Match the digits with the labels and follow the protocol to form the groups. 45 46 71 17 09 77 55 80 00 95 32 86 32 94 85 82 22 69 00 56
There are many types of experimental designs in use today in the sciences…read about these on p. 189-191 (3.1, 7/8 & 8/8): • Completely randomized: all experimental units are allocated at random among all treatments (Ex. 3.10) • Block designs: A block is a group of experimental units or subjects known in advance to be similar in some way that is expected to affect the response to the treatments. Knowing this, the experimenter can create a block design, in which the random assignment of units is carried out separately within each block. See examples 3.18-3.20 for some examples • Matched pairs: This is a common design in which a block design is used to compare just two treatments. Sometimes each subject receives both treatments (acts as its own control), or there is a “before-after” design.
Completely randomized designs Completely randomized experimental designs: Individuals are randomly assigned to groups, then the groups are randomly assigned to treatments.
Block designs In a block,orstratified, design, subjects are divided into groups, or blocks, prior to the experiment to test hypotheses about differences between the groups. The blocking, or stratification, here is by gender.
The most closely matched pair studies use identical twins. Matched pairs designs Matched pairs: Choose pairs of subjects that are closely matched—e.g., same sex, height, weight, age, and race. Within each pair, randomly assign who will receive which treatment. It is also possible to just use a single person, and give the two treatments to this person over time in random order (“before”/”after”). In this case, the “matched pair” is just the same person at different points in time. Pre/post testing of a new teaching method is another example...
Read the Introduction & Section 3.1. Watch the StatTutors - I'll assign them officially on the StatsPortal. Pay particular attention to all the Examples. Make sure you understand the terminology and the sketches of the types of designs... Also, make sure you can use Table B to perform a completely randomized design. • Do # 3.3, 3.4, 3.6, 3.7, 3.9, 3.11, 3.12, 3.18, 3.19, 3.21, 3.26, 3.27-3.29, 3.35, 3.39 • Test #1 will cover Chapters 1-3 and some parts of Ch.4. Start getting ready for it!