Download
1 / 29
290 likes | 361 Views
Free Migration between the EU and Switzerland: Impacts on the Swiss Economy and Implications for Monetary Policy January 2010 Peter Stalder, Swiss National Bank, Research. 1. Background information 2. Migration agreement with the EU – main results

E N D
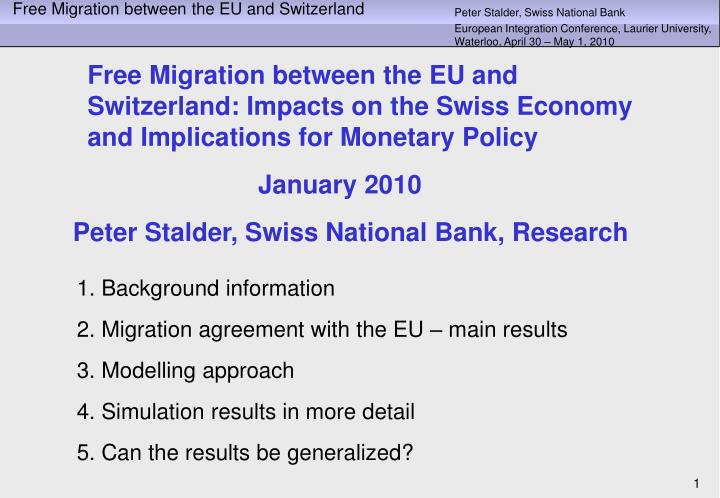
Free Migration between the EU and Switzerland: Impacts on the Swiss Economy and Implications for Monetary Policy January 2010 Peter Stalder, Swiss National Bank, Research 1. Background information 2. Migration agreement with the EU – main results 3. Modelling approach 4. Simulation results in more detail 5. Can the results be generalized?
European Union and Switzerland as an outsider 1. Background information Population in 2009: Total 7.8 Mio Swiss 6.1 Mio Foreign 1.7 Mio • Bilateral Agreements with the EU • Reciprocal opening of markets in several areas: • Free movement of persons (effective as of mid-2002) • Technical trade barriers • Public procurement procedures • Agriculture • Air and land transport • Participation in research programs
1. Background information French, (Swiss-)German, Italian and Romansh as languages
Foreigners in total population in percent, 1900 - 2007 1. Background information
Foreign population (in 1000) by origin, 1988-2008 1. Background information other countries France Spain Turkey Germany Portugal Italy ex Yugoslavia
Foreign employment by category, 1960-2008 1. Background information 27% of total employ-ment Cross-border 5-year permit for EU citizens Seasonal / temporary Annual permit (renewable) Permanent residence permit
180,000 160,000 140,000 120,000 100,000 80,000 60,000 40,000 1985 1990 1995 2000 2005 1. Background information Net-immigration and unemployment, 1981-2009 Unemployment rate Immigration Net-immigration Emigration
Net-immigration and unemployment, 1981-2009 1. Background information 2008 2007 2009 1981
Agreement with the European Union on free migration between the EU and Switzerland: 2. Migration agreement – main results • Effective as of June 2002. • Entitles citizens from EU member states to take long-term residence in Switzerland on the condition that they possess a valid work contract. • Reciprocal right for Swiss citizens to work and live in the EU. • Certain quotas remained in place in the first years of the treaty but were abolished by mid-2007. • Prior to that date, firms tended to circumvent the restrictions by hiring workers from the EU for a start on basis of temporary permits. • Since June 2004 Swiss firms do no longer have to give priority to job applicants already residing in Switzerland.
2. Migration agreement – main results • Analysis on basis of an existing macroeconometric model, accounting for the dynamic interaction between immigration, the labor market, aggregate demand, wage-price setting and monetary policy. • Comparison of the development 2002-2008, as it took place under the agreement, with a “status quo ante” simulation. • Main results: • Facilitated immigration reduced the incidence of labor shortages. • It also stimulated the economy from the demand-side (consumption, housing investment, equipment investment). • GDP growth was raised by 0.5 percentage points p.a. on average, amounting to a level difference of 3.2% in 2008. • The employment effect was a bit weaker, implying slightly higher productivity growth. • Inflation was reduced only marginally because the increased supply potential was largely absorbed by a stronger expansion of aggregate demand. A relatively lax course of monetary policy contributed to this outcome. • The unemployment rate was lifted by 0.5 to 0.7 percentage points. • Households incurred a loss in real wage growth of 0.25 percentage points p.a. on average, amounting to a level difference of 1.7% in 2008.
Supply Block Productionfunction GDP vs. Potential Output G Labor demand vs. labor supply Employment L Wage and price formation W = f(P, L ) P = f(W, G ) Household income = f(wage- and capital income) AggregateDemand Block Consumption Investment Export - Import GDP Proportion of capacity-constrained firms Proportion of labor-constrained firms Monetary Block SRATE = f(,ΔGDP, ECHF/EUR)“Taylor rule“ LRATE = f(SRATE, LRATEEU) ECHF/EUR = f(spreadCHF vs. spreadEU) Inflation World Economy (exogenous):GDP in EU, USA , Japan and “Dynamic Asia“ International Prices and Interest rates, Oil price 3. Modelling approach
LD 3. Modelling approach Demand and supply-constrained micro labor marktes Excess supply: Li = LDi < LS Excess demand: Li = LS < LDi LDi LS
L L LD V U 3. Modelling approach Demand and supply-constrained micro labor marktes Excess supply: Li = LDi < LS Excess demand: Li = LS < LDi LDi LS
L LD L 3. Modelling approach Demand and supply-constrained micro labor marktes Excess supply: Li = LDi < LS Excess demand: Li = LS < LDi Filling vacancies by EU workers LDi L LS
NAIRU Migration agreement 3. Modelling approach Impact of the migration agreement: Idealistic view Beveridge curve 4 3 VRATE 2 Status quo 1 0 2 4 0 1 3 URATE
1.3 1.2 1.1 1.0 E 0.9 T A R V 0.8 0.7 0.6 0.5 0.4 1.5 2.0 2.5 3.0 3.5 4.0 4.5 5.0 5.5 U R A T E 3. Modelling approach Empirical U-V relationship,1997q1-2009q4 2001q1 2001q1 2008q2 2008q2 2003q2 2003q2 1997q1 2009q4
1.3 1.2 1.1 1.0 E 0.9 T A R V 0.8 0.7 0.6 0.5 0.4 1.5 2.0 2.5 3.0 3.5 4.0 4.5 5.0 5.5 U R A T E 3. Modelling approach Empirical U-V relationship,1997q1-2009q4 Total employment (in 1000), 1995q1-2009q4 2001q1 2001q1 2008q2 2008q2 + 8.4% 2003q2 + 4.8% 2003q2 1997q1
Migration agreement 3. Modelling approach Impact of the migration agreement: Realistic view Beveridge curve 4 3 Migration agreement VRATE 2 Status quo 1 0 2 4 0 1 3 URATE
L LD 3. Modelling approach Demand and supply-constrained micro labor marktes Excess supply: Li = LDi < LS Excess demand: Li = LS < LDi LDi LS
3. Modelling approach Ltemp = f(πL) (temporary and cross-border workers) LD L LS(LF, …) πL LF = LFSwiss+ LFforeign(long-term residents, 16-64) Production function Aggregate demand LFforeign = f(πL) Under the migration agreement, the reactions to πLbecame stronger and/or quicker. POP = POPSwiss + POPforeign(long-term residents) POPforeign = f(πL)
3. Modelling approach Example: Equation for the number of temporary and cross-border workers – Parameter shifts due to the agreement: Ltemp = f(πL) Δlog(Ltempt) = -b1Δlog(1-πt) – γ[log(Ltempt-1) - β0 + β1log(1-πt-1)] 0.19 4.20 1.15 historical (status quo ante) 0.32 4.57 1.94 under the agreement
2008q2 4. Simulation results in more detail U-V relationship actual (under the influence of the agreement) “status quo ante” simulation (suppressing the parameter shifts caused by the agreement) In the downturn 2001-2003, the unemployment rate increased from 1.8% to 3.9%. Under "status quo ante" conditions, it would have risen to 3.5% only. In the upswing 2004-2008, unemployment fell from 3.9% to 2.5%. Under “status quo ante” conditions, it would have declined more strongly to 1.8%. 2008q2 2008q2 2001q4 2003q3 2003q4
2008q2 4. Simulation results in more detail U-V relationship actual (under the influence of the agreement) “status quo ante” simulation (suppressing the parameter shifts caused by the agreement) In the downturn 2001-2003, the unemployment rate increased from 1.8% to 3.9%. Under "status quo ante" conditions, it would have risen to 3.5% only. In the upswing 2004-2008, unemployment fell from 3.9% to 2.5%. Under “status quo ante” conditions, it would have declined more strongly to 1.8%. Status quo ante VRATE Migration agreement URATE
4. Simulation results in more detail Real GDP growth in % Proportion of labor-constrained firms The agreement has mitigated labor shortages, raising firms’ production potential from the supply side. Together with the stimulating effects of immigration on aggregate demand, this has raised GDP growth, entailing a level difference in real GDP of 3.2% in 2008.
1.25 1.20 1.15 1.10 1.05 1.00 0.95 00 01 02 03 04 05 06 07 08 a c t u a l W A G E s t a t u s q u o a n t e W A G E a c t u a l C P I s t a t u s q u o a n t e C P I 4. Simulation results in more detail Wages and prices (indices 2000 = 1) Unemployment rate in % and weaker real wage growth, amounting to a real wage loss of 1.7% in 2008. On the other hand, households were facing higher unemployment …
4. Simulation results in more detail Inflation in % (GDP-deflator) 3M-Libor in % Under the positive supply-side effects of the migration agreement monetary policy pursued a relatively lax course, stimulating GDP growth from the demand side. Even so, inflation was slightly lower than it would have been under “status quo ante” conditions. This policy course, which was appropriate given the positive supply-side effects of the agreement, would have been inflationary in its absence. Inflation as measured by the GDP deflator (CPI inflation) would have increased to 5.7% in 2007 (5.3% in 2008).
5. Can the results be generalized? • The above simulation results refer to the period 2002-2008. Can they be generalized? Two difficulties: • The opening of the Swiss labor market towards immigration from the EU has transitory and permanent effects: Transition to a “new regime”, changed functioning of the economy under the “new regime”. These two effects are difficult to disentangle. • The parameter shifts are estimated over a period in which the Swiss economy was on an upswing. The finding of increased upward flexibility of labor supply does not necessarily imply symmetrically increased downward flexibility in a downturn.
5. Can the results be generalized? • Replication of the forecasting situation at the end of 2008, under the following assumptions in the forecast period: • Exogenous world economy variables: Recession in 2009, followed by a somewhat hesitant recovery from 2010 onwards. • Three versions of the model for Switzerland, distinguished by the equations used for Ltemp = f(πL), LFforeign = f(πL) and POPforeign = f(πL): • Status quo ante (parameter shifts suppressed): SQA • Stronger reactions toπLsymmetrically both in downturns and upturns: SYM • Stronger reactions to πLonly in upturns: ASYM
5. Can the results be generalized? Foreign labor force (LFforeign, q-on-q change in %) Proportion of labor-constrained firms (πL) Unemployment rate (URATE, in %) .32 4.5 5.5 4.0 5.0 .28 3.5 4.5 .24 3.0 4.0 .20 2.5 3.5 .16 2.0 3.0 .12 1.5 2.5 .08 1.0 2.0 2008 2009 2010 2011 2012 2013 2014 2015 2008 2009 2010 2011 2012 2013 2014 2015 2008 2009 2010 2011 2012 2013 2014 2015 SQA SYM A S Y M SQA SYM A S Y M SQA SYM A S Y M Comparing SYM with SQA: The symmetrically enhanced reaction of foreign labor to tension in the labor market (πL) dampens the swings in unemployment without affecting the level of unemployment in the long run. Comparing ASYM with SQA: Stronger reaction of foreign labor to tension in the labor market only in the upswing results in a “ratchet effect”: Unemployment increases by more in the downturn than it decreases in the subsequent upswing.