Download
1 / 30
300 likes | 388 Views
Selection for high β-glucan content and good agronomic performance in oat grain. Alona A. Chernyshova Professor: Jean-Luc Jannink Iowa State University Department of Agronomy American Oat Workers Conference Fargo, ND 25 July 2006. Outline. Introduction Objectives Materials and methods

E N D
Selection for high β-glucan content and good agronomic performance in oat grain Alona A. Chernyshova Professor: Jean-Luc Jannink Iowa State University Department of Agronomy American Oat Workers Conference Fargo, ND 25 July 2006
Outline • Introduction • Objectives • Materials and methods • Results • Conclusions
Introduction • -glucan(1-3)(1-4)-β-D is a soluble fiber found in the endosperm and subaleurone layers of cereal seeds
Introduction The structure of oat groat • -glucan(1-3)(1-4)-β-D is a soluble fiber found in the endosperm and subaleurone layers of cereal seeds • -glucan is responsible for many health related effects of oat: • reduction of blood cholesterol levels • reduction of the risk of coronary heart disease • reduction of the risk of diabetes • attenuation of blood glucose and insulin, and • prolonged satiety • Standard oat varieties contain from 4.5 to 5.0 % of -glucan • We would like to double this concentration
Introduction • Viscosity is the thickness or resistance to flow of a liquid • Many health related effects of oats result from the high viscosity of their soluble β-glucans • Regression analyses have shown a positive effect of -glucan content on viscosity • Viscosity deviation • Deviation of viscosity from its prediction based on -glucan content • We call this the “viscosity deviation” • Viscosity of some oat lines deviated significantly from the regression prediction, indicating that, for a given -glucan content, some lines generate more viscosity and some less viscosity
Objectives • to estimate the genetic components of variance in -glucan content, viscosity, and viscosity deviation in high -glucan lines, elite agronomic lines, and in their population crosses • to evaluate the differences between elite agronomic lines and high -glucan lines for -glucan, viscosity, and viscosity deviation • to use a powerful population design to detect epistatic interaction among parents
Twelve lines selected for good agronomic performance from the Uniform Oat Performance Nursery coordinated by the USDA Twelve lines selected for high beta-glucan content from the Iowa State University Oat Breeding Program F1 generation represented by 48 crosses F3 individuals derived from F1 by selfing In 2005 lines were planted in two locations with four replications and analyzed for beta-glucan and viscosity Materials and methods Figure 2.Experimental program
Materials and methods Mating design North Carolina Design II
Materials and methods • The -glucan concentration in flours was determined enzymatically using a mixed linkage -glucan kit (Megazyme Int., Wicklow, Ireland) • Modifications were made to the Approved Method, which allowed us to increase the number of samples analyzed per unit time and cost spent Micro Enzymatic Method
Materials and methods Micro Enzymatic Method
Materials and methods Micro Enzymatic Method Microplate reader measures the light absorbance in each cell that reflects the amount of β-glucan in the sample
Materials and methods Glucose standards
Materials and methods Glucose standards
Materials and methods • Viscosity was measured using a Rapid Visco Analyser (RVA, Newport Scientific Warriewood, Australia), as a function of temperature, time, and stirring Viscosity Measurements
Materials and methods The Rapid Visco-Analyser is used to measure the apparent viscosity of samples as a function of temperature, time, and stirring
Small Preliminary Experiment • to maximize the solubilization of -glucan over a short period of time while also avoiding a contribution of starch gelatinization to viscosity • Jim, Paul, IA95111, and N979-5-2-4 • -amylase was added to eliminate the contribution of starch to the viscosity of oat flour • Constant temperature 45 °C or constant temperature 55 °C
Small Preliminary Experiment • Data was analysed with SAS proc GLM • All factors (oat line, temperature, and presence / absence of -amylase, and all pair-wise interactions) were considered fixed • The dependent variables were log-transformed peak viscosity and log-transformed average viscosity between 5 to 7 minutes
Small Preliminary Experiment • No effect of -amylase • At these temperatures starch does not contribute to viscosity • Oat line (P < 0.001) • Mean log-transformed peak viscosity Jim, Paul, IA95111, and N979-5-2-4 were 4.25, 4.42, 5.05, and 5.69, respectively • The effect of temperature was marginally significant (P = 0.08) • Mean log-transformed peak viscosity of 4.81 and 4.89 for 40 °C and 55 °C, respectively • Correlation (r2=0.99) between log-transformed peak viscosity and log-transformed average viscosity between 5 to 7 minutes
Small Preliminary Experiment • Silver nitrate inactivates -glucanases present in the flour and originating from grain or microbial contamination • Log peak viscosities with and without silver nitrate were 4.36 versus 4.36 for Jim, and 5.12 versus 5.07 for IA95111 • We chose to use deionized water for all subsequent experiments
Materials and methods Viscosity Measurements The viscosity measurement was the average viscosity from 5 to 7 minutes on the pasting curve
Nutritional function and good agronomic performance in oat Statistical analysis • Lines were planted in an incomplete block design with four replications at each of two environments (Ames and Kanawha) • A set, which consisted of four inbred agronomic parents, four inbred -glucan parents, and 16 F3:4 progeny lines, was assigned to each incomplete block • In each replication, a family was represented by a different F3:4 progeny line North Carolina Design II
Nutritional function and good agronomic performance in oat Statistical Analysis • The relationship between flour -glucan content and flour slurry viscosity was best linearized by taking the logarithm of slurry viscosity r2=0.35
Nutritional function and good agronomic performance in oat • All traits showed significant genetic variance • Viscosity and grain yield showed significant specific combining ability variance indicating interactions between loci affecting these traits Results and discussion
Nutritional function and good agronomic performance in oat Results and discussion H2 = [var(Fam) + var(L)] / [var(Fam) + var(L) + var(Err)] • These heritabilities were high, ranging from 0.42 for the viscosity deviation to 0.82 for viscosity itself
Conclusion • The study found relatively high heritabilities for the traits -glucan content, flour slurry viscosity, and viscosity deviation that are relevant for the selection of oat lines with high nutritional function • The study confirmed that the mode of gene action of loci affecting -glucan was primarily additive, but found observable interallelic interaction variance for flour slurry viscosity • This interaction variance may further explain the transgressive segregation for flour slurry viscosity that was observed
Conclusion • Finally, the study showed for the first time that selection for viscosity deviation is feasible • While at this time we do not know what are the mechanisms generating viscosity deviations, the fact that the trait is selectable should allow us to divergently select for the trait and to study the differences among lines with high and low viscosity deviation
Thank you Acknowledgements • My major professor: Jean-Luc Jannink • My committee members: Pamela J. White M. Paul Scott • Dr. Sedat Sayar and Dr. Ni Yao • Merinda Struthers • George Patrick and Ron Skrdla • All graduate students in my group • USDA-NRI Competitive Grants Program, award number 2004-02413
Nutritional function and good agronomic performance in oat • Variance components and predictors of line effects were estimated in a Bayesian analysis using WinBUGS Statistical Analysis Pijkm = Blki + Popj + Parentk(j) + Errorm Liabcd = Blki + + Agra + Betb + Agr*Betab + Linec(ab) + Errord Pijkm = Blki + *ijkm + Popj + Parentk(j) + Errorm Liabcd= Blki + *iabcd+ + Agra + Betb+ Agr*Betab + Linec(ab) + Errord
Nutritional function and good agronomic performance in oat Results and discussion
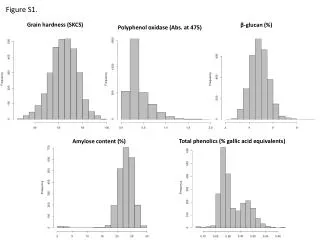
Population -glucan content Log RVA Grain yield g kg-1 Log (RVU) g m-2 Agronomic 0.75 * 0.82 * -0.08NS -glucan 0.03NS 0.66 * 0.87 * Nutritional function and good agronomic performance in oat Results and discussion *P < 0.05