Download
1 / 35
350 likes | 514 Views
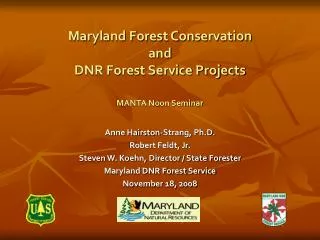
Forest Inventory Attributes for Aboriginal Portal Pilot Project: Manitoba. M.J. Filiatrault, R.J. Hall. Purpose. Conduct pilot study t o provide estimates of total volume, merchantable volume and total biomass for forested softwood, hardwood and mixedwood reserves in Manitoba.

E N D
Forest Inventory Attributes for Aboriginal PortalPilot Project: Manitoba M.J. Filiatrault, R.J. Hall
Purpose • Conduct pilot study to provide estimates of total volume, merchantable volume and total biomass for forested softwood, hardwood and mixedwood reserves in Manitoba. • To determine potential to extend estimates of forest attributes for aboriginal bands at a national scale if results from pilot are deemed satisfactory.
How was Biomass Mapped: Biomass Baseline • Objective: Produce first spatially contiguous forest biomass map of Canada at EOSD LC product tile level (circa 2000). • Approach: Integrate CanFI 2001 Age, climate grids to estimate site, Ecozones, NFI models and EOSD land cover to estimate volume and biomass. • Product assessment: Compare estimates with independent inventory data at 6 regions across Canada. • Delivery: NFI at NFI plot level in geotiff. CAT at EOSD LC product tile
CanFI2001 Age: (Ht Lookup) • Data set revised by NFI (Feb 2007) • Most dominant age class for cell (7 classes) • Based on McKenney et al. (2001) • 300 arc second spatial res. (~10km) • 1961-1990 normals for temp and precip. • Used for deriving site class map • 4 classes: cool_dry, cool_wet, warm_dry and warm_wet Climate Data: (Ht Lookup) Ecozones: (Ht and Vol.) • 1: 7,500,000 scale data from AAFC EOSD LC: (Ht and Vol.) • 1: 250,000 map sheets from SAFORAH • Required for forest type and density Spatial Data Set Sources
EOSD:Land Cover Framework Earth Observation for Sustainable Development of Forests (EOSD) • Circa 2000 land cover • 477 Landsat frames • 610, 1:250,000 maps • 4-5 yr production • Data posted on: • http://www.saforah.org/
Vegetated, Treed Pixel Level Processing NFI Scenario 4 Vegetated, non-treed No Yes Stand Ht Age, Site, Species, CC, Ecoz. Total Vol. Species, CC, Ecoz. Prov., Species, Ecoz. Merch.Vol. Merch. vol.> 0 NFI Scenario 3 Treed, non-merch No Yes Stem wood biomass Proportion Models Pstemwood, Pbark Pbranches, Pfoliage Total Biomass: Scenario 3 or 4 Total Biomass: (Stem wood biomass)/(Pstemwood) Branches Total biomass xPbranches Stemwood Tot. biomass xPstemwood Bark Total biomass xPbark Foliage Total biomass xPfoliage Implementation of NFI models
Total Volume (m3/ha) Pilot Regions Prince George Labrador Vancouver Island Hinton Western Nfld Mistassini
Pilot Regions Prince George Labrador Vancouver Island Hinton Western Nfld Mistassini Merchantable Volume(m3/ha)
Aboveground Biomass (tonnes/ha) Pilot Regions Prince George Labrador Vancouver Island Hinton Western Nfld Mistassini
Product provides indicator of relative magnitude and spatial distribution of volume and biomass across Canada. Accuracy of EOSD-Biomass data a function of it’s inputs (i.e. CanFI, site quality at 10km resolution). EOSD is of variable quality in land cover classification across Canada. CanFI age is dated and coarse in some regions of Canada, was spatially similar for most of MB. Product was designed for distribution and reporting at 10 km resolution. EOSD-Biomass Map
Study Area: Manitoba • Validation: • Cross Lake • Sapotaweyak
Vector for aboriginal lands converted to raster to create points for every EOSD-Biomass pixel to be sampled. Data was extracted from the EOSD landcover, and each of the baseline products. Attribute data was converted from density measure (i.e. m3/ha to m3) and summed by cover type for each aboriginal band. For validation - inventories were classified into forest types and volumes converted from density measure using polygon size. Methods
Conifer Deciduous Mixed Results Northern ecozones: Taiga Shield, Boreal Shield, Hudson Plains
Conifer Deciduous Mixed Results Southern ecozones: Boreal Plains, Prairies
In northern ecozones, relative proportion of CDM and volume/ha were similar across reserves. Bands residing in southern ecozones exhibit higher productivity and were more variable than bands residing in northern ecozones. Reserves within the Prairies notably dominated by deciduous consistent with knowledge of vegetation distribution within the ecozone. The proportion of merchantable to total volume varies between bands: e.g. Sapotaweyak has higher total volume but less merchantable volume than Mathias Colomb Reflection of age class distribution Results
Validation – Cross Lake LandcoverIf FLI correct,EOSD appears to overestimate conifer, and has more forested area.
FRI EOSD Validation – Cross Lake
Validation – Cross Lake Volume • Can only compare gross merchantable volume. • Estimates related to polygons and converted to m3 based on polygon area, Caution on false precision of numbers. • Summed by cover type for all reserves in Cross Lake (conifer, deciduous, mixed, non-forest).
Inventory conducted in 1985 Differences in forest type definitions Registration errors in inventory Changes in age structure make it difficult to compare Volume sampling roughly one for every 18,750 ha (Gillis and Leckie, 1993) Nearby estimates used when polygon did not have volume samples Are polygon areas suitable to convert from density measure? Validation – Cross Lake Considerations
Validation – Sapotaweyak LandcoverNotable differences in forest type distributions
FLI EOSD Validation – Sapotaweyak
Can only compare total gross volume Estimates related to polygons and converted to m3 Be aware of false precision in interpretation Summed by cover type for select reserves in Sapotaweyak Validation – Sapotaweyak Volume
Inventory conducted in 2001 (EOSD 2000) Definition of vegetation cover is different between EOSD and FLI Reported polygon areas were different than areas in shapefile Differences from FRI: More current than FLI Crown closure classes/vegetation cover Both inventories use volume based on dominant species, age and density All polygons with the same parameters gets assigned same volume/ha value Metadata on deriving volume estimates for inventories is lacking Validation – Sapotaweyak Considerations
Differences in forest type definitions influence volume estimates but amount is unknown. Was the validation exercise appropriate? What level of similarity would have been considered acceptable? At what scale? What would be the impact from sampling 10km product for bands with small reserves (< 10,000 ha)? Should there be an area size limit for reporting? Should we report in m3 or m3/ha? Should we report by reserve or band? Discussion
Pending national biomass source product, national scaling would entail: Derive estimates using 10km product if using current national biomass map (MF, RH) Get current national data for aboriginal lands (MF) Assign each reserve represented in spatial dataset to a band (?) Organize reserves by NTS 250K mapsheet if using current national biomass map Prep baseline products and database (MF) Prepare scripts for automation of process (MF) Forest attribute reporting (RH, MF) Future Efforts
Is CFS national biomass map for circa 2000 a suitable product for assignment of biomass at reserves particularly since many are smaller than the appropriate resolution of the product? Roughly 80% of aboriginal bands are <10K hectares in size. Pilot study evaluation was attempt to validate national biomass map with independent data from Manitoba for two reserves. Validation really wasn’t appropriate, undertaken at 25m resolution. Our national assessment is a more comprehensive assessment of the national biomass map. Big Question
Boudewyn, P.A., X. Song, S. Magnussen, and M.D. Gillis. (2007) Model-based, volume-to-biomass conversion for forested and vegetated land in Canada. Natural Resources Canada, Canadian Forest Service, Pacific Forestry Centre, Victoria, BC. Information Report BC-X-411. 112 p. Forest Lands Inventory Technical Advisory Committee. (2000) Development of a Forest Lands Inventory for Manitoba. Final Report Gillis, M.D. and D.G. Leckie. (1993) Forest Inventory Mapping Procedures across Canada. Petawawa National Forestry Insitute. Information Report PI-X-114 Wulder, M. A., J. Dechka, M. Gillis, J. Luther, R. J. Hall, A. Beaudoin, and S. E. Franklin (2003). Operational mapping of the land cover of the forested area of Canada with Landsat data: EOSD land cover program. The Forestry Chronicle, 79(6):1075-1083. Wulder, M.A., J.C. White, M. Cranny, R.J. Hall, J.E. Luther, A. Beaudoin, D.G. Goodenough, and J.A. Dechka (2008). Monitoring Canada’s forests. Part 1: Completion of the EOSD land cover project. Canadian Journal of Remote Sensing, 34(6):549-562 References
MODIS and NFI spatial interpolation MODIS land cover (250 m pixel): EOSD vs MODIS land cover: calibration, update NASA JPL 1 km canopy height map CFS “Lots of Plots” airborne LiDAR (Mike Wulder) GLAS – ICESat footprints over Canada Integrate LiDAR measurements with national baseline Perspectives/Approaches forUpdating National Biomass Map
1. MODIS and NFI Spatial Interpolation • Rationale: NFI, MODIS • Approach: k-NN imputation of NFI plots. • Imputation between NFI biomass estimates and MODIS 250m spectral response. • Predicated upon yearly MODIS-derived land cover and NFI plot updates.
2a. EOSD vs MODIS LC EOSD LC Circa 2000 Land cover classified to EOSD legend: CCRS MODIS LC 2005
2b. NASA JPL Canopy Height Map Canopy ht (m) 2 – 5 6 – 10 11 – 15 16 – 20 21 – 25 26 – 30 31+ 1 km resolution f [Env var, TRMM, MODIS] ICESat GLAS calibration Source: Marc Simard, Naiara Pinto Caltech/Jet Propulsion Lab
2c. CFS “Lots of Plots” Airborne LiDAR Transect
ICESat Tracks for Fort Providence Study Area Close-up on laser footprints ICESat Tracks 170m ~65 m 2d. GLAS - ICESat 7.5 km Spacing @ 60oN
MODIS and NFI spatial interpolation MODIS land cover (250 m pixel): EOSD vs MODIS land cover: calibration, update NASA JPL 1 km canopy height map CFS “Lots of Plots” airborne LiDAR (Mike Wulder) GLAS – ICESat footprints over Canada Integrate LiDAR measurements with national baseline Perspectives/Approaches forUpdating National Biomass Map