Download
1 / 10
100 likes | 318 Views
Count data, contingency tables and log-linear models. Expected frequency: Log-linear models are linear models of the log expected frequency (log is used as link function). A log-linear model for independence. The last parameter of each kind can be set to zero.

E N D
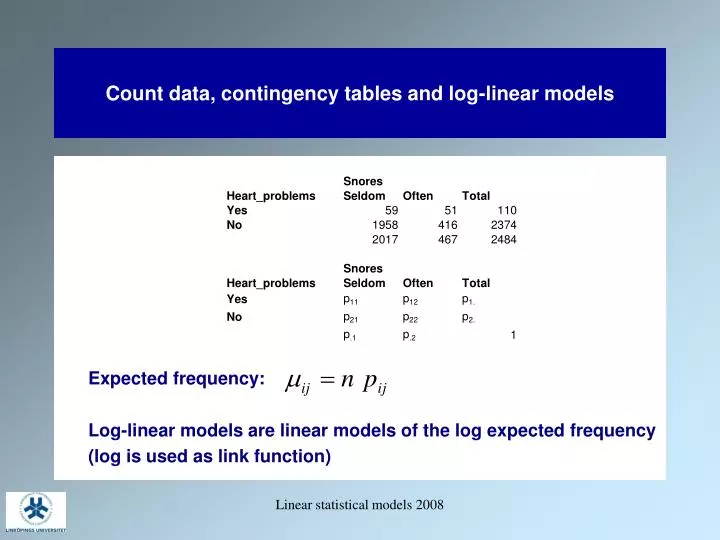
Count data, contingency tables and log-linear models Expected frequency: Log-linear models are linear models of the log expected frequency (log is used as link function) Linear statistical models 2008
A log-linear model for independence The last parameter of each kind can be set to zero Linear statistical models 2008
The saturated log-linear model Independence can be tested by relating the difference in deviance D2 – D1 to a 2 distribution with df2 – df1 degrees of freedom. What is D1 anddf1 for the saturated model? Linear statistical models 2008
The multinomial distribution Consider a nominal random variable that takes k distinct values with probabilities p1, p2, …, pk Assume that have made n independent observations of that variable Then wher nj is the number of times thejth value is observed Note that n is fixed in a multinomial distribution. If the observations arrive randomly, a Poisson distribution is usually preferable. Linear statistical models 2008
Analysis of example data procgenmod data=linear.snoring; class snore heart; model count = snore heart/link=log dist=Poisson; run; Can a Poisson distribution be justified? Linear statistical models 2008
Higher order tables Consider the following data on drug use Model: Linear statistical models 2008
Terminology A = alcohol C = cigarette M = marijuana Model A C M: mutual independence model Model A C M A*C A*M C*M: homogenous association model Model A C M A*C A*M: Model in which C and M are mutually independent when controlling for A Linear statistical models 2008
Contingency table with one response variable Consider the example data written in the following form procgenmod data=linear.snoring2; class snore; model heart/total = snore/link=logit dist=binomial; run; Linear statistical models 2008
Poisson regression I Poisson distribution Log link where x is a covariate Linear statistical models 2008
Poisson regression II Poisson distribution Log link where the parameters are row, column and treatment effects Linear statistical models 2008