Download
1 / 13
130 likes | 140 Views
Electron Exposure of MgO. Slade J. Jokela, I. Veryovkin, A. Zinovev. MgO – Sample QP118. MgO sample prepared by Qing Peng 6nm film of MgO on low resistivity Si Sample had low secondary emission Possibly due to long shelf time Large amount of surface contamination.

E N D
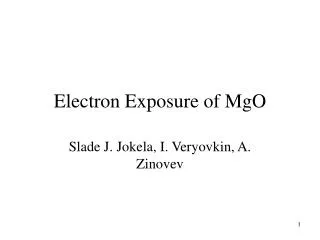
Electron Exposure of MgO Slade J. Jokela, I. Veryovkin, A. Zinovev
MgO – Sample QP118 • MgO sample prepared by Qing Peng • 6nm film of MgO on low resistivity Si • Sample had low secondary emission • Possibly due to long shelf time • Large amount of surface contamination
MgO After 600eV Electron Exposure MgO - Initial MgO – After 13 hrs electron exposure F F F F O O O O C C C Mg Mg Double C peaks Double Peak is now Difficult to resolve
5 keV Ar+ Sputtering 30 more seconds Ar+ sputtering 10 seconds Ar+ sputtering F O C Mg
MgO After 600eV Electron Exposure After 18 more hours electron exposure After 40seconds total Ar+ sputtering F F F F O O O O C C C Mg Mg
Further Ar+ Sputtering • 120 seconds of Ar+ sputtering • Carbon peaks virtually eliminated • Fluorine peak reduced to 3 at.% • 240 seconds of Ar+ sputtering • Fluorine peak reduced to 1.9 at.% • Si substrate becoming visible in XPS spectrum • 360 seconds of Ar+ sputtering • Si is obviously showing through • Fluorine peak ‘increased’ to 2.3% • Such a small increase is difficult to confirm
Secondary Emission • Emission spectra were taken sequentially and are labeled from B to K (1 to 10 respectively) • Each spectrum is an average of 5 taken over 1.5 minutes (0.3 minutes for each) • Periodic ‘noise’ was later eliminated by delaying scans by a very short period so that the coupled signal did not reinforce itself in the average.
Secondary Emission 1.) Initial 2.) 13hr Electron 3.) 40s Ar+ Sputter 4.) 18hr Electron
Summary of Data Analysis • This was an initial test on an old sample • Test should be repeated on a newer and on a thicker sample • I will look back at older samples to see if emission degradation has occurred • Secondary emission determination has changed since then, so it may not be possible to directly compare older spectra to newer spectra • Different electron energies should be studied
Mass Spectrometry EXISTING ITEMS REQ. MODIFICATIONS SCHEMATIC ERROR Electron Gun • Surface desorption • Electron stimulated desorption • Temperature Prog. Desorp. • If we know what is being removed from the surface during these processes, we may be able to accelerate the scrubbing process Mass Spec Main Chamber Attached Here Transfer Arm Attached here Heated Sample Holder Mislocated in drawing, port is on right, not left, side Turbopump attached here