Download
1 / 53
530 likes | 587 Views
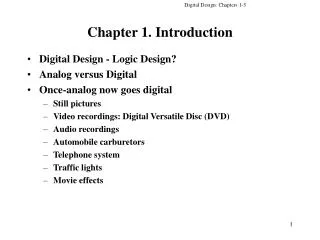
Chapter 1 Introduction. Computer Networking: A Top Down Approach , 5 th edition. Jim Kurose, Keith Ross Addison-Wesley, April 2009. Introduction 1- 1. millions of connected computing devices: hosts = end systems running network apps. PC. Mobile network. server. Global ISP. wireless

E N D
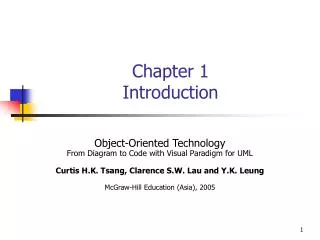
Chapter 1Introduction Computer Networking: A Top Down Approach ,5th edition. Jim Kurose, Keith RossAddison-Wesley, April 2009. Introduction 1-1
millions of connected computing devices: hosts = end systems running network apps PC Mobile network server Global ISP wireless laptop cellular handheld Home network Regional ISP access points wired links Institutional network router What’s the Internet: “nuts and bolts” view • communication links • fiber, copper, radio, satellite • transmission rate = bandwidth • routers: forward packets (chunks of data) Introduction 1-2
“Fun” internet appliances Web-enabled toaster + weather forecaster IP picture frame http://www.ceiva.com/ Slingbox: watch, control cable TV remotely Internet refrigerator Internet phones Introduction 1-3
protocolscontrol sending, receiving of msgs e.g., TCP, IP, HTTP, Skype, Ethernet Internet: “network of networks” loosely hierarchical public Internet versus private intranet Internet standards RFC: Request for comments IETF: Internet Engineering Task Force Mobile network Global ISP Home network Regional ISP Institutional network What’s the Internet: “nuts and bolts” view Introduction 1-4
communication infrastructure enables distributed applications: Web, VoIP, email, games, e-commerce, file sharing communication services provided to apps: reliable data delivery from source to destination “best effort” (unreliable) data delivery What’s the Internet: a service view Introduction 1-5
Get http://www.awl.com/kurose-ross Got the time? 2:00 time What’s a protocol? Hi TCP connection request Hi TCP connection response <file> Introduction 1-6
network edge: applications and hosts A closer look at network structure: • access networks, physical media: wired, wireless communication links • network core: • interconnected routers • network of networks Introduction 1-7
end systems (hosts): run application programs e.g. Web, email at “edge of network” peer-peer client/server The network edge: • client/server model • client host requests, receives service from always-on server • e.g. Web browser/server; email client/server • peer-peer model: • minimal (or no) use of dedicated servers • e.g. Skype, BitTorrent Introduction 1-8
Dial-up Modem central office telephone network Internet homedial-up modem ISPmodem (e.g., AOL) home PC Introduction 1-9
telephone network Digital Subscriber Line (DSL) Existing phone line:0-4KHz phone; 4-50KHz upstream data; 50KHz-1MHz downstream data Internet home phone DSLAM splitter DSL modem central office home PC Introduction 1-10
Residential access: cable modems Diagram: http://www.cabledatacomnews.com/cmic/diagram.html Introduction 1-11
Cable Network Architecture: Overview Typically 500 to 5,000 homes cable headend home cable distribution network (simplified) Introduction 1-12
server(s) Cable Network Architecture: Overview cable headend home cable distribution network Introduction 1-13
Cable Network Architecture: Overview cable headend home cable distribution network (simplified) Introduction 1-14
C O N T R O L D A T A D A T A V I D E O V I D E O V I D E O V I D E O V I D E O V I D E O 5 6 7 8 9 1 2 3 4 Channels Cable Network Architecture: Overview FDM (more shortly): cable headend home cable distribution network Introduction 1-15
ONT ONT ONT Fiber to the Home opticalfibers Internet opticalfiber OLT optical splitter central office Introduction 1-16
Ethernet Internet access institutional router 100 Mbps to institution’sISP Ethernet switch 100 Mbps 1 Gbps 100 Mbps server Introduction 1-17
Wireless access networks router base station mobile hosts Introduction 1-18
Home networks wireless laptops to/from cable headend cable modem router/ firewall wireless access point Ethernet Introduction 1-19
Physical Media Twisted Pair (TP) Coaxial cable Fiber optic cable Introduction 1-20
The Network Core Introduction 1-21
Network Core: Circuit Switching Introduction 1-22
Example: 4 users FDM frequency time TDM frequency time Circuit Switching: FDM and TDM Introduction 1-23
Numerical example • How long does it take to send a file of 640,000 bits from host A to host B over a circuit-switched network? • all link speeds: 1.536 Mbps • each link uses TDM with 24 slots • 500 msec to establish end-to-end circuit Let’s work it out! Introduction 1-24
D E Packet Switching: Statistical Multiplexing 100 Mb/s Ethernet C A statisticalmultiplexing 1.5 Mb/s B queue of packets waiting for output link Introduction 1-25
takes L/R seconds to transmit (push out) packet of L bits on to link at R bps delay = 3L/R (assuming zero propagation delay) Example: L = 7.5 Mbits R = 1.5 Mbps transmission delay = 15 sec Packet-switching: store-and-forward L R R R more on delay shortly … Introduction 1-26
Example: 1 Mb/s link each user: 100 kb/s when “active” active 10% of time circuit-switching: 10 users packet switching: with 35 users, probability > 10 active at same time is less than .0004 Packet switching allows more users to use network! Packet switching versus circuit switching N users ….. 1 Mbps link Introduction 1-27
Large Content Distributor (e.g., Google) Large Content Distributor (e.g., Akamai) IXP IXP Internet structure: network of networks Tier 1 ISP Tier-1 ISPs & Content Distributors, interconnect (peer) privately Tier 1 ISP Tier 1 ISP … or at Internet Exchange Points IXPs Introduction 1-28
Internet structure: network of networks Large Content Distributor (e.g., Google) Large Content Distributor (e.g., Akamai) Tier 1 ISP Tier 1 ISP Tier 1 ISP IXP IXP Tier 2 ISP Tier 2 ISP Tier 2 ISP Tier 2 ISP Tier 2 ISP Tier 2 ISP Tier 2 ISP Tier 2 ISP Tier 2 ISP Introduction 1-29
Internet structure: network of networks Large Content Distributor (e.g., Google) Large Content Distributor (e.g., Akamai) Tier 1 ISP Tier 1 ISP Tier 1 ISP IXP IXP Tier 2 ISP Tier 2 ISP Tier 2 ISP Tier 2 ISP Tier 2 ISP Tier 2 ISP Tier 2 ISP Tier 2 ISP Tier 2 ISP Introduction 1-30
Internet structure: network of networks Large Content Distributor (e.g., Google) Large Content Distributor (e.g., Akamai) Tier 1 ISP Tier 1 ISP Tier 1 ISP IXP IXP Tier 2 ISP Tier 2 ISP Tier 2 ISP Tier 2 ISP Tier 2 ISP Tier 2 ISP Tier 2 ISP Tier 2 ISP Tier 2 ISP Introduction 1-31
packet being transmitted (delay) packets queueing (delay) free (available) buffers: arriving packets dropped (loss) if no free buffers How do loss and delay occur? A B Introduction 1-32
dproc: nodal processing check bit errors determine output link typically < msec transmission A propagation B nodal processing queueing Four sources of packet delay dnodal = dproc + dqueue + dtrans + dprop dqueue: queueing delay • time waiting at output link for transmission • depends on congestion level of router Introduction 1-33
Four sources of packet delay transmission A propagation B nodal processing dtrans and dprop very different queueing dnodal = dproc + dqueue + dtrans + dprop dprop: propagation delay: • d: length of physical link • s: propagation speed in medium (~2x10⁸ m/sec) • dprop = d/s dtrans: transmission delay: • L: packet length (bits) • R: link bandwidth (bps) • dtrans = L/R Introduction 1-34
cars “propagate” at 100 km/hr toll booth takes 12 sec to service car (transmission time) car~bit; caravan ~ packet Q: How long until caravan is lined up before 2nd toll booth? time to “push” entire caravan through toll booth onto highway = 12*10 = 120 sec time for last car to propagate from 1st to 2nd toll both: 100km/(100km/hr)= 1 hr A: 62 minutes 100 km 100 km ten-car caravan toll booth toll booth Caravan analogy Introduction 1-35
cars now “propagate” at 1000 km/hr toll booth now takes 1 min to service a car Q:Will cars arrive to 2nd booth before all cars serviced at 1st booth? A: Yes! After 7 min, 1st car arrives at second booth; three cars still at 1st booth. 1st bit of packet can arrive at 2nd router before packet is fully transmitted at 1st router! (see Ethernet applet at AWL Web site) 100 km 100 km ten-car caravan toll booth toll booth Caravan analogy (more) Introduction 1-36
R: link bandwidth (bps) L: packet length (bits) a: average packet arrival rate Queueing delay (revisited) average queueing delay traffic intensity = La/R La/R ~ 0 • La/R ~ 0: avg. queueing delay small • La/R -> 1: avg. queueing delay large • La/R > 1: more “work” arriving than can be serviced, average delay infinite! Queuing and packet loss applet La/R -> 1 Introduction 1-37
“Real” Internet delays and routes traceroute: gaia.cs.umass.edu to www.eurecom.fr Three delay measurements from gaia.cs.umass.edu to cs-gw.cs.umass.edu 1 cs-gw (128.119.240.254) 1 ms 1 ms 2 ms 2 border1-rt-fa5-1-0.gw.umass.edu (128.119.3.145) 1 ms 1 ms 2 ms 3 cht-vbns.gw.umass.edu (128.119.3.130) 6 ms 5 ms 5 ms 4 jn1-at1-0-0-19.wor.vbns.net (204.147.132.129) 16 ms 11 ms 13 ms 5 jn1-so7-0-0-0.wae.vbns.net (204.147.136.136) 21 ms 18 ms 18 ms 6 abilene-vbns.abilene.ucaid.edu (198.32.11.9) 22 ms 18 ms 22 ms 7 nycm-wash.abilene.ucaid.edu (198.32.8.46) 22 ms 22 ms 22 ms 8 62.40.103.253 (62.40.103.253) 104 ms 109 ms 106 ms 9 de2-1.de1.de.geant.net (62.40.96.129) 109 ms 102 ms 104 ms 10 de.fr1.fr.geant.net (62.40.96.50) 113 ms 121 ms 114 ms 11 renater-gw.fr1.fr.geant.net (62.40.103.54) 112 ms 114 ms 112 ms 12 nio-n2.cssi.renater.fr (193.51.206.13) 111 ms 114 ms 116 ms 13 nice.cssi.renater.fr (195.220.98.102) 123 ms 125 ms 124 ms 14 r3t2-nice.cssi.renater.fr (195.220.98.110) 126 ms 126 ms 124 ms 15 eurecom-valbonne.r3t2.ft.net (193.48.50.54) 135 ms 128 ms 133 ms 16 194.214.211.25 (194.214.211.25) 126 ms 128 ms 126 ms 17 * * * 18 * * * 19 fantasia.eurecom.fr (193.55.113.142) 132 ms 128 ms 136ms trans-oceanic link * means no response (probe lost, router not replying) Introduction 1-38
Rs > RcWhat is average end-end throughput? Rsbits/sec Rcbits/sec Rcbits/sec Throughput • Rs < RcWhat is average end-end throughput? Rsbits/sec Introduction 1-39
Throughput: Internet scenario • per-connection end-end throughput: min(Rc,Rs,R/10) • in practice: Rc or Rs is often bottleneck Rs Rs Rs R Rc Rc Rc 10 connections (fairly) share backbone bottleneck link Rbits/sec Introduction 1-40
application: supporting network applications FTP, SMTP, HTTP transport: process-process data transfer TCP, UDP network: routing of datagrams from source to destination IP, routing protocols link: data transfer between neighboring network elements Ethernet, 802.111 (WiFi), PPP physical: bits “on the wire” Internet protocol stack application transport network link physical Introduction 1-41
presentation: allow applications to interpret meaning of data, e.g., encryption, compression, machine-specific conventions session: synchronization, checkpointing, recovery of data exchange Internet stack “missing” these layers! -- these services, if needed, must be implemented in application ISO/OSI reference model application presentation session transport network link physical Introduction 1-42
network link physical link physical M M M Ht M Hn Hn Hn Hn Ht Ht Ht Ht M M M M Hn Ht Ht Hl Hl Hl Hn Hn Hn Ht Ht Ht M M M source Encapsulation message application transport network link physical segment datagram frame switch destination application transport network link physical router Introduction 1-43
Trojan horse hidden part of some otherwise useful software today often in Web page (Active-X, plugin) virus infection by receiving object (e.g., e-mail attachment), actively executing self-replicating: propagate itself to other hosts, users Bad guys: put malware into hosts via Internet worm: • infection by passively receiving object that gets itself executed • self- replicating: propagates to other hosts, users Sapphire Worm: aggregate scans/sec in first 5 minutes of outbreak (CAIDA, UWisc data) Introduction 1-44
target Bad guys: attack server, network infrastructure Denial of Service (DoS): attackers make resources (server, bandwidth) unavailable to legitimate traffic by overwhelming resource with bogus traffic 1. select target 2. break into hosts around the network (see botnet) 3. send packets to target from compromised hosts Introduction 1-45
src:B dest:A payload The bad guys can sniff packets Packet sniffing: • broadcast media (shared Ethernet, wireless) • promiscuous network interface reads/records all packets (e.g., including passwords!) passing by C A B Introduction 1-46
src:B dest:A payload The bad guys can use false source addresses IP spoofing:send packet with false source address C A B Introduction 1-47
The bad guys can record and playback record-and-playback: sniff sensitive info (e.g., password), and use later • password holder is that user from system point of view C A src:B dest:A user: B; password: foo B Introduction 1-48
1961: Kleinrock - queueing theory shows effectiveness of packet-switching 1964: Baran - packet-switching in military nets 1967: ARPAnet conceived by Advanced Research Projects Agency 1969: first ARPAnet node operational 1972: ARPAnet public demonstration NCP (Network Control Protocol) first host-host protocol first e-mail program ARPAnet has 15 nodes Internet History 1961-1972: Early packet-switching principles Introduction 1-49
1970: ALOHAnet satellite network in Hawaii 1974: Cerf and Kahn - architecture for interconnecting networks 1976: Ethernet at Xerox PARC late70’s: proprietary architectures: DECnet, SNA, XNA late 70’s: switching fixed length packets (ATM precursor) 1979: ARPAnet has 200 nodes Cerf and Kahn’s internetworking principles: minimalism, autonomy - no internal changes required to interconnect networks best effort service model stateless routers decentralized control define today’s Internet architecture Internet History 1972-1980: Internetworking, new and proprietary nets Introduction 1-50