Download
1 / 17
170 likes | 299 Views
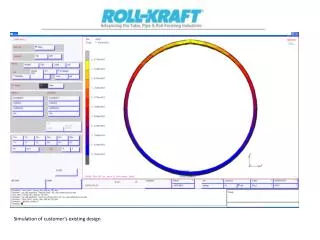
Design of a Simulation Toolbox of Intestinal Electrical Activity. John Gouda Advisor: Alan Bradshaw, Ph.D. Motivation of Project. The living state physics group have state of the art equipment to measure the magnetic field of the small intestine.

E N D
Design of a Simulation Toolbox of Intestinal Electrical Activity • John Gouda • Advisor: Alan Bradshaw, Ph.D.
Motivation of Project • The living state physics group have state of the art equipment to measure the magnetic field of the small intestine. • The magnetic field can be used to estimate the electric field: trans-membrane potential and slow currents. • Thus, the need arose for an educational tool to help the investigators understand the quantitative features of electrical activity in the small intestine. • The project can also serve as an educational tool for BME 251-252.
Experiment • The following outlines the experimental procedures in the living state physics group. • The data was collected from rabbit small intestine using platinum monopolar electrodes. • 20 electrodes placed at 20 different location along the intestine 1 cm apart. • Data was sampled for 5 minutes per study at a rate of 20-30 Hz. • Data was sampled at the three section of the small intestine (duodenum, jejunum, ileum) and during induced ischemic conditions. • The clinical goal of the study is to investigate the difference between healthy electrical activity and pathologies: diabetic gastroparesis, mesenteric ischemia.
Design SpecificationsUser Demands • The simulation toolbox should: • 1. Give the user an intuitive grasp of GI electrical activity • 2. Rely on an accurate, intuitive model of GI electrical activity • 3. Relate model simulations with experimental data
Project SpecificationsUser Wishes • If possible, the simulation toolbox should: • 1. Have a user-friendly interface • 2. Provide the user with “on the spot” calculations and metrics that represent the response of the model to the parameters supplied to the toolbox. Provide the user with a measure of goodness of fit with experimental data. • 3. Provide the user with “on the spot” graphics that represent the response of the model to the parameters supplied to the toolbox • 4. Provide the user with analysis modules that can analyze the complexity of GI activity and provide intuition into the physiologic function of GI tract.
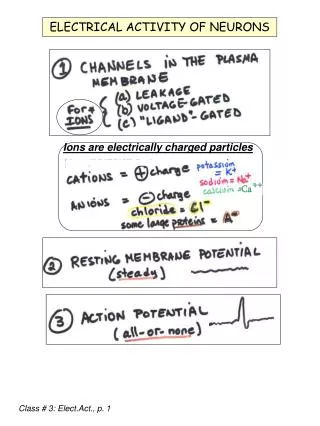
Mathematical Background • 1960 Nelson and Becker suggest that a chain of relaxation oscillators (RO) could simulate GI electrical activity. • 1971 Sarna et al. Used a modified version of the Van der Pol oscillator to simulate GI electrical activity. We used the widely acclaimed model developed by Sarna (1971). • Relaxation Oscillators • The name “relaxation oscillators” comes into place because the “stress” accumulated during the slow buildup of charge on the membrane is “relaxed” during the sudden depolarization of the action potential.
Our model • We used the widely acclaimed simple model developed by Sarna (1971). • The model consists of 16 coupled nonlinear oscillators. The oscillators are lined along a straight line in the intestine. • The user can gain an intuitive feel for the effect of model parameters on the collective behavior of the model by utilizing the GUI interface. • The model is not intended to entirely reproduce quantitative features of GI electrical activity, but rather to show the basic characteristics qualitatively (Sarna, 1971).
Equations of the model • 16 coupled oscillators, each oscillator has the form dxn/dt = alpha (e yn + f xn + g xn^2 + h xn^3 + C1 xn-1 + C2 xn+1) dyn/dt = -1/alpha (b yn + w^2 xn + c xn^2 + d xn^3 - a) xn= transmembrane potential yn= slow currents w= frequency of oscillation if the system was reduced to an undamped, unforced harmonic osc. C1 = coupling constants with previous oscillator C2= coupling constant with next oscillator n = number of oscillators
Equations of Simple Models • Van der pol • can be transformed to • two forms--> • Fitzhugh
Undamped, unforced harmonic osc. b=dampening factor m=mass k=spring constant w^2=k/m where w=frequency Introduce a new variable y such that y=dx/dt do that math and you get Converting a 2nd order differential equation into 2 first order differential equations
Connection with simple models • The above system can be reduced to the following systems: • Unforced Damped harmonic oscillator • in eq. 1: set alpha=e=1,f=g=h=0, c1=c2=0 • in eq. 2: set w=frequency, c=d=a=0 • add a term b*y in eq.2 where b=dampening factor/mass • Unforced Van der Pol oscillator • in eq. 1: set e=1, f=1, g=0, h=-1/3, c1=c2=0 • in eq.2: set w =frequency, c=d=a=0 • Fitzhugh oscillator • in eq.1: set e=1,f=1,g=0, h=-1/3, c1=c2=0, add a term z • in eq. 2: add a term b*y, set w=frequency, set c=d=0 • in all models, use c1 and c2 as coefficients of a forcing function
Schematic of the Model • C1=forward coupling factor • C2=backward coupling factor
Demo • Only Two Commands • At the MATLAB prompt: • type ‘playmodel’ to run the simulation • type ‘plotmodel’ to plot a 3D graph of the results • type ‘runvdp’ to simulate the Van der pol oscillator • type ‘runharmonic’ to simulate the harmonic oscillator
Conclusions • GI electrical activity may be modeled with coupled nonlinear oscillators • MATLAB provided a user-friendly environment that facilitated creation of a user-driven simulation and educational tool • Snapshots of the phase space of each oscillator reveal differences between the dynamics of each oscillator • Model results agree qualitatively with experimental data (Sarna, 1971)
References • Sarna SK, Daniel EE, Kingma YJ (1971): Simulation of slow-wave electrical activity of small intestine. Am J Physiol, 221(1):165-75. • Aliev RR, Richards W, Wikswo JP: A simple nonlinear model of electrical activity in the intestine. (in press)
Acknowledgements • Many thanks to: • Jimmy Nguyen, B.E., VU BME • Rubin Aliev, Ph.D., VU Physics • John Wikswo, Ph.D., VU Physics • William Richards, M.D., VU Surgery • Allison Redmond, B.E., VU Physics