Download
1 / 9
90 likes | 92 Views
A sportswear distributor selling discounted jerseys in bulk. Use regression analysis to predict the cost of jerseys and YouTube views.

E N D
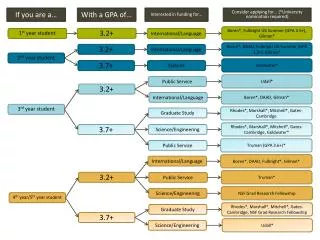
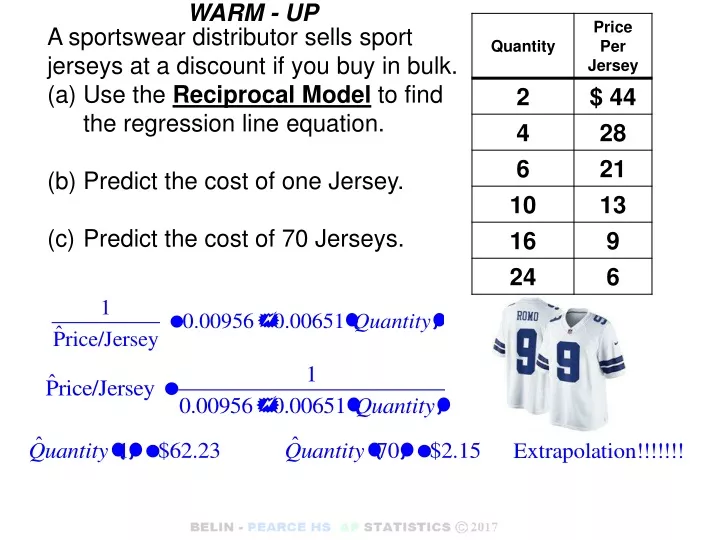
WARM - UP • A sportswear distributor sells sport jerseys at a discount if you buy in bulk. • Use the Reciprocal Model to find the regression line equation. • Predict the cost of one Jersey. • Predict the cost of 70 Jerseys.
A YouTuber posted a new video online and wanted to know how many “views” it will get in 30 days. POWER FUNCTION So, Take the LOG of Both the x and y variables and perform a Regression LinReg (L3=LOG(x) , L4=LOG(y)). When x = 30 ŷ = 63417.4
During a chemistry lab, students were asked to study a radioactive element which decays over time. The results are in the table. Time (in days) 0 2 4 6 8 10 Element (in grams) 320 226 160 115 80 57 • Use an equation to Model the remaining mass of the element. b. Find the predicted amount of the element remaining after thirty days. Log(Element) = 2.505 – 0.0749(Time) (Element) = 102.505·10–0.0749(Time) Element = (319.89)(0.8416) time Element = (319.89)(0.8416) 30 = 1.812 grams
#11 POWER FUNCTION So, Take the LOG of Both the x and y variables and perform a Regression LinReg (L3=LOG(x) , L4=LOG(y)). When x = 4200 ŷ = 303.7446
Movie Year Ticket $ 1948 $0.36 1954 $0.49 1958 $0.68 1963 $0.86 1967 $1.22 1971 $1.65 1974 $1.89 1974 $2.03 1976 $2.13 1977 $2.23 Movie Year Ticket $ 1978 $2.34 1979 $2.47 1980 $2.69 1981 $2.78 1982 $2.94 1983 $3.15 1984 $3.36 1985 $3.55 1986 $3.71 1987 $3.91 1988 $4.11 1. The average movie ticket prices in selected years since 1948 are listed in the table to the right. a. Use re-expressed data to create a model that predicts ticket prices. Let L1= x = (Year – 1900) b. Find the movie ticket price this model predicts for 2004.
a.) Let explanatory variable be Year – 1900; so, 1948 is input as 48. Let response variable be log(Ticket Price) Exponential Logarithmic model: log(Ticket)= −1.73 + 0.0269(Year −1900) 10log(Ticket)= 10−1.73∙ 10 0.0269(Year −1900) Ticket= 0.0186 ∙1.0639(Year-1900) b.) Ticket= 0.0186 ∙1.0639(2004-1900) = 11.68