Download
1 / 54
560 likes | 982 Views
Course Goals. Understand the components of a Virtual InstrumentIntroduce LabVIEW and common LabVIEW functions Build a simple data acquisition applicationCreate a subroutine in LabVIEW. Section I. LabVIEW termsComponents of a LabVIEW applicationLabVIEW programming toolsCreating an application i

E N D
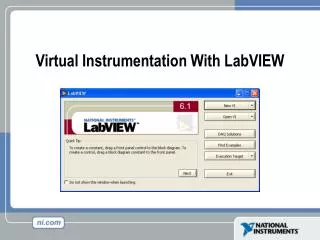
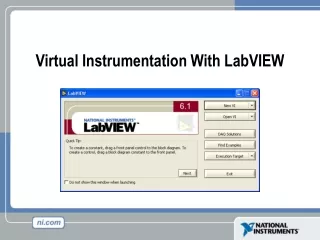
1. Virtual Instrumentation With LabVIEW
2. Course Goals Understand the components of a Virtual Instrument
Introduce LabVIEW and common LabVIEW functions
Build a simple data acquisition application
Create a subroutine in LabVIEW This is a list of the objectives of the course.
This course prepares you to do the following:
� Use LabVIEW to create applications.
� Understand front panels, block diagrams, and icons and connector panes.
� Use built-in LabVIEW functions.
� Create and save programs in LabVIEW so you can use them as subroutines.
This course does not describe any of the following:
� Programming theory
� Every built-in LabVIEW function or object
� Analog-to-digital (A/D) theoryThis is a list of the objectives of the course.
This course prepares you to do the following:
� Use LabVIEW to create applications.
� Understand front panels, block diagrams, and icons and connector panes.
� Use built-in LabVIEW functions.
� Create and save programs in LabVIEW so you can use them as subroutines.
This course does not describe any of the following:
� Programming theory
� Every built-in LabVIEW function or object
� Analog-to-digital (A/D) theory
3. Section I LabVIEW terms
Components of a LabVIEW application
LabVIEW programming tools
Creating an application in LabVIEW
4. LabVIEW Programs Are Called Virtual Instruments (VIs) LabVIEW programs are called virtual instruments (VIs).
Stress that controls equal inputs, indicators equal outputs.
Each VI contains three main parts:
Front Panel � How the user interacts with the VI.
Block Diagram � The code that controls the program.
Icon/Connector � Means of connecting a VI to other VIs.
The Front Panel is used to interact with the user when the program is running. Users can control the program, change inputs, and see data updated in real time. Stress that controls are used for inputs- adjusting a slide control to set an alarm value, turning a switch on or off, or stopping a program. Indicators are used as outputs. Thermometers, lights, and other indicators indicate values from the program. These may include data, program states, and other information.
Every front panel control or indicator has a corresponding terminal on the block diagram. When a VI is run, values from controls flow through the block diagram, where they are used in the functions on the diagram, and the results are passed into other functions or indicators.LabVIEW programs are called virtual instruments (VIs).
Stress that controls equal inputs, indicators equal outputs.
Each VI contains three main parts:
Front Panel � How the user interacts with the VI.
Block Diagram � The code that controls the program.
Icon/Connector � Means of connecting a VI to other VIs.
The Front Panel is used to interact with the user when the program is running. Users can control the program, change inputs, and see data updated in real time. Stress that controls are used for inputs- adjusting a slide control to set an alarm value, turning a switch on or off, or stopping a program. Indicators are used as outputs. Thermometers, lights, and other indicators indicate values from the program. These may include data, program states, and other information.
Every front panel control or indicator has a corresponding terminal on the block diagram. When a VI is run, values from controls flow through the block diagram, where they are used in the functions on the diagram, and the results are passed into other functions or indicators.
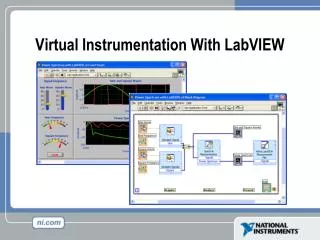
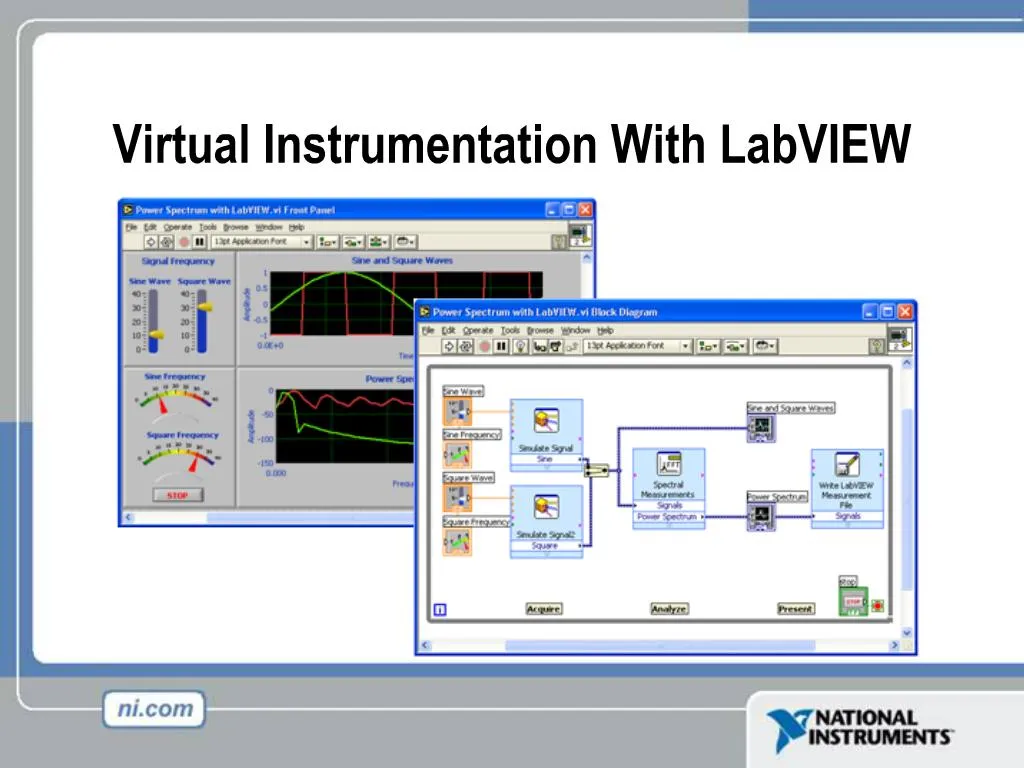
5. VI Front Panel The front panel is the user interface of the VI. You build the front panel with controls and indicators, which are the interactive input and output terminals of the VI, respectively. Controls are knobs, pushbuttons, dials, and other input devices. Indicators are graphs, LEDs, and other displays. Controls simulate instrument input devices and supply data to the block diagram of the VI. Indicators simulate instrument output devices and display data the block diagram acquires or generates.
In this picture, the Power switch is a boolean control. A boolean contains either a true or false value. The value is false until the switch is pressed. When the switch is pressed, the value becomes true. The temperature history indicator is a waveform graph. It displays multiple numbers. In this case, the graph will plot Deg F versus Time (sec).
The front panel also contains a toolbar, whose functions we will discuss later.
The front panel is the user interface of the VI. You build the front panel with controls and indicators, which are the interactive input and output terminals of the VI, respectively. Controls are knobs, pushbuttons, dials, and other input devices. Indicators are graphs, LEDs, and other displays. Controls simulate instrument input devices and supply data to the block diagram of the VI. Indicators simulate instrument output devices and display data the block diagram acquires or generates.
In this picture, the Power switch is a boolean control. A boolean contains either a true or false value. The value is false until the switch is pressed. When the switch is pressed, the value becomes true. The temperature history indicator is a waveform graph. It displays multiple numbers. In this case, the graph will plot Deg F versus Time (sec).
The front panel also contains a toolbar, whose functions we will discuss later.
6. VI Block Diagram The block diagram contains this graphical source code. Front panel objects appear as terminals on the block diagram. Additionally, the block diagram contains functions and structures from built-in LabVIEW VI libraries. Wires connect each of the nodes on the block diagram, including control and indicator terminals, functions, and structures.
In this block diagram, the subVI Temp calls the subroutine which retrieves a temperature from a Data Acquisition (DAQ) board. This temperature is plotted along with the running average temperature on the waveform graph Temperature History. The Power switch is a boolean control on the Front Panel which will stop execution of the While Loop. The While Loop also contains a Timing Function to control how frequently the loop iterates.
The block diagram contains this graphical source code. Front panel objects appear as terminals on the block diagram. Additionally, the block diagram contains functions and structures from built-in LabVIEW VI libraries. Wires connect each of the nodes on the block diagram, including control and indicator terminals, functions, and structures.
In this block diagram, the subVI Temp calls the subroutine which retrieves a temperature from a Data Acquisition (DAQ) board. This temperature is plotted along with the running average temperature on the waveform graph Temperature History. The Power switch is a boolean control on the Front Panel which will stop execution of the While Loop. The While Loop also contains a Timing Function to control how frequently the loop iterates.
7. LabVIEW 7.0 introduced a new type of subVI called Express VIs. These are interactive VIs that have a configuration dialog box that allows the user to customize the functionality of the Express VI. LabVIEW then generates a subVI based on these settings.
Standard VIs are VIs (consisting of a front panel and a block diagram) that are used within another VI.
Functions are the building blocks of all VIs. Functions do not have a front panel or a block diagram.LabVIEW 7.0 introduced a new type of subVI called Express VIs. These are interactive VIs that have a configuration dialog box that allows the user to customize the functionality of the Express VI. LabVIEW then generates a subVI based on these settings.
Standard VIs are VIs (consisting of a front panel and a block diagram) that are used within another VI.
Functions are the building blocks of all VIs. Functions do not have a front panel or a block diagram.
8. Controls and Functions Palettes Use the Controls palette to place controls and indicators on the front panel. The Controls palette is available only on the front panel. Select Window�Show Controls Palette or right-click the front panel workspace to display the Controls palette. You also can display the Controls palette by right-clicking an open area on the front panel. Tack down the Controls palette by clicking the pushpin on the top left corner of the palette.
Use the Functions palette, to build the block diagram. The Functions palette is available only on the block diagram. Select Window�Show Functions Palette or right-click the block diagram workspace to display the Functions palette. You also can display the Functions palette by right-clicking an open area on the block diagram. Tack down the Functions palette by clicking the pushpin on the top left corner of the palette.
Use the Controls palette to place controls and indicators on the front panel. The Controls palette is available only on the front panel. Select Window�Show Controls Palette or right-click the front panel workspace to display the Controls palette. You also can display the Controls palette by right-clicking an open area on the front panel. Tack down the Controls palette by clicking the pushpin on the top left corner of the palette.
Use the Functions palette, to build the block diagram. The Functions palette is available only on the block diagram. Select Window�Show Functions Palette or right-click the block diagram workspace to display the Functions palette. You also can display the Functions palette by right-clicking an open area on the block diagram. Tack down the Functions palette by clicking the pushpin on the top left corner of the palette.
9. Tools Palette If automatic tool selection is enabled and you move the cursor over objects on the front panel or block diagram, LabVIEW automatically selects the corresponding tool from the Tools palette. Toggle automatic tool selection by clicking the Automatic Tool Selection button in the Tools palette.
Use the Operating tool to change the values of a control or select the text within a control.
Use the Positioning tool to select, move, or resize objects. The Positioning tool changes shape when it moves over a corner of a resizable object.
Use the Labeling tool to edit text and create free labels. The Labeling tool changes to a cursor when you create free labels.
Use the Wiring tool to wire objects together on the block diagram.
If automatic tool selection is enabled and you move the cursor over objects on the front panel or block diagram, LabVIEW automatically selects the corresponding tool from the Tools palette. Toggle automatic tool selection by clicking the Automatic Tool Selection button in the Tools palette.
Use the Operating tool to change the values of a control or select the text within a control.
Use the Positioning tool to select, move, or resize objects. The Positioning tool changes shape when it moves over a corner of a resizable object.
Use the Labeling tool to edit text and create free labels. The Labeling tool changes to a cursor when you create free labels.
Use the Wiring tool to wire objects together on the block diagram.
10. Status Toolbar Click the Run button to run the VI. While the VI runs, the Run button appears with a black arrow if the VI is a top-level VI, meaning it has no callers and therefore is not a subVI.
Click the Continuous Run button to run the VI until you abort or pause it. You also can click the button again to disable continuous running.
While the VI runs, the Abort Execution button appears. Click this button to stop the VI immediately.
Note: Avoid using the Abort Execution button to stop a VI. Either let the VI complete its data flow or design a method to stop the VI programmatically. By doing so, the VI is at a known state. For example, place a button on the front panel that stops the VI when you click it.
Click the Pause button to pause a running VI. When you click the Pause button, LabVIEW highlights on the block diagram the location where you paused execution. Click the Pause button again to continue running the VI.
Select the Text Settings pull-down menu to change the font settings for the VI, including size, style, and color.
Select The Align Objects pull-down menu to align objects along axes, including vertical, top edge, left, and so on.
Select the Distribute Objects pull-down menu to space objects evenly, including gaps, compression, and so on.
Select the Resize Objects pull-down menu to change the width and height of front panel objects.Click the Run button to run the VI. While the VI runs, the Run button appears with a black arrow if the VI is a top-level VI, meaning it has no callers and therefore is not a subVI.
Click the Continuous Run button to run the VI until you abort or pause it. You also can click the button again to disable continuous running.
While the VI runs, the Abort Execution button appears. Click this button to stop the VI immediately.
Note: Avoid using the Abort Execution button to stop a VI. Either let the VI complete its data flow or design a method to stop the VI programmatically. By doing so, the VI is at a known state. For example, place a button on the front panel that stops the VI when you click it.
Click the Pause button to pause a running VI. When you click the Pause button, LabVIEW highlights on the block diagram the location where you paused execution. Click the Pause button again to continue running the VI.
Select the Text Settings pull-down menu to change the font settings for the VI, including size, style, and color.
Select The Align Objects pull-down menu to align objects along axes, including vertical, top edge, left, and so on.
Select the Distribute Objects pull-down menu to space objects evenly, including gaps, compression, and so on.
Select the Resize Objects pull-down menu to change the width and height of front panel objects.
11. Select the Reorder pull-down menu when you have objects that overlap each other and you want to define which one is in front or back of another. Select one of the objects with the Positioning tool and then select from Move Forward, Move Backward, Move To Front, and Move To Back.
<the following items only appear on the bock diagram toolbar>
Click the Highlight Execution button to see the flow of data through the block diagram. Click the button again to disable execution highlighting.
Click the Step Into button to single-step into a loop, subVI, and so on. Single-stepping through a VI steps through the VI node to node. Each node blinks to denote when it is ready to execute. By stepping into the node, you are ready to single-step inside the node.
Click the Step Over button to step over a loop, subVI, and so on. By stepping over the node, you execute the node without single-stepping through the node.
Click the Step Out button to step out of a loop, subVI, and so on. By stepping out of a node, you complete single-stepping through the node and go to the next node.Select the Reorder pull-down menu when you have objects that overlap each other and you want to define which one is in front or back of another. Select one of the objects with the Positioning tool and then select from Move Forward, Move Backward, Move To Front, and Move To Back.
<the following items only appear on the bock diagram toolbar>
Click the Highlight Execution button to see the flow of data through the block diagram. Click the button again to disable execution highlighting.
Click the Step Into button to single-step into a loop, subVI, and so on. Single-stepping through a VI steps through the VI node to node. Each node blinks to denote when it is ready to execute. By stepping into the node, you are ready to single-step inside the node.
Click the Step Over button to step over a loop, subVI, and so on. By stepping over the node, you execute the node without single-stepping through the node.
Click the Step Out button to step out of a loop, subVI, and so on. By stepping out of a node, you complete single-stepping through the node and go to the next node.
12. Open and Run a Virtual Instrument 1. Select Start � Programs � National Instruments � LabVIEW 7.0 � LabVIEW to launch LabVIEW. The LabVIEW dialog box appears.
2. Select Find Examples from the Help menu. The dialog box that appears lists and links to all available LabVIEW example VIs.
3. You can browse examples by categories, or you can use a keyword search. Click the Search tab to open the keyword browser.
4. In the �Enter Keyword(s)� box enter �Signal�
5. A list of related topics will appear in the examples window. Double-click on signals, this will list examples on the right side.
6. Click on any program to see a detailed description of the example. Double-click Signal Generation and Processing.vi to launch this example.
This will open the �Signal Generation and Processing.vi� Front Panel.
Examine the VI and run it. Change the frequencies and types of the input signals and notice how the display on the graph changes. Change the Signal Processing Window and Filter options. After you have examined the VI and the different options you can change, stop the VI by pressing the Stop button.
Note You also can open the VI by clicking the Open VI button and navigating to labview\examples\apps\demos.llb\Signal Generation and Processing.vi.1. Select Start � Programs � National Instruments � LabVIEW 7.0 � LabVIEW to launch LabVIEW. The LabVIEW dialog box appears.
2. Select Find Examples from the Help menu. The dialog box that appears lists and links to all available LabVIEW example VIs.
3. You can browse examples by categories, or you can use a keyword search. Click the Search tab to open the keyword browser.
4. In the �Enter Keyword(s)� box enter �Signal�
5. A list of related topics will appear in the examples window. Double-click on signals, this will list examples on the right side.
6. Click on any program to see a detailed description of the example. Double-click Signal Generation and Processing.vi to launch this example.
This will open the �Signal Generation and Processing.vi� Front Panel.
Examine the VI and run it. Change the frequencies and types of the input signals and notice how the display on the graph changes. Change the Signal Processing Window and Filter options. After you have examined the VI and the different options you can change, stop the VI by pressing the Stop button.
Note You also can open the VI by clicking the Open VI button and navigating to labview\examples\apps\demos.llb\Signal Generation and Processing.vi.
13. Creating a VI When you create an object on the Front Panel, a terminal will be created on the Block Diagram. These terminals give you access to the Front Panel objects from the Block Diagram code.
Each terminal contains useful information about the Front Panel object it corresponds to. For example, the color and symbols provide the data type. Double-precision, floating point numbers are represented with orange terminals and the letters DBL. Boolean terminals are green with TF lettering.
In general, orange terminals should wire to orange terminals, green to green, and so on. This is not a hard-and-fast rule; LabVIEW will allow a user to connect a blue terminal (integer value) to an orange terminal (fractional value), for example. But in most cases, look for a match in colors.
Controls have an arrow on the right side and have a thick border. Indicators have an arrow on the left and a thin border. Logic rules apply to wiring in LabVIEW: Each wire must have one (but only one) source (or control), and each wire may have multiple destinations (or indicators).
The program in this slide takes data from A and B and passes the values to both an Add function and a subtract function. The results are displayed on the appropriate indicators.When you create an object on the Front Panel, a terminal will be created on the Block Diagram. These terminals give you access to the Front Panel objects from the Block Diagram code.
Each terminal contains useful information about the Front Panel object it corresponds to. For example, the color and symbols provide the data type. Double-precision, floating point numbers are represented with orange terminals and the letters DBL. Boolean terminals are green with TF lettering.
In general, orange terminals should wire to orange terminals, green to green, and so on. This is not a hard-and-fast rule; LabVIEW will allow a user to connect a blue terminal (integer value) to an orange terminal (fractional value), for example. But in most cases, look for a match in colors.
Controls have an arrow on the right side and have a thick border. Indicators have an arrow on the left and a thin border. Logic rules apply to wiring in LabVIEW: Each wire must have one (but only one) source (or control), and each wire may have multiple destinations (or indicators).
The program in this slide takes data from A and B and passes the values to both an Add function and a subtract function. The results are displayed on the appropriate indicators.
14. Creating a VI � Block Diagram In addition to Front Panel terminals, the Block diagram contains functions. Each function may have multiple input and output terminals. Wiring to these terminals is an important part of LabVIEW programming.
Once you have some experience programming in LabVIEW, wiring will become easy. At first, you may need some assistance. Here are some tips to get you started:
The wiring tool is used to wire to the nodes of the functions. When you �aim� with the wiring tool, aim with the end of the wire hanging from the spool. This is where the wire will be placed.
As you move the wiring tool over functions, watch for the yellow tip strip. This will tell you the name of the terminal you are wiring to.
As you move the wiring tool over a terminal, it will flash. This will help you identify where the wire will attach.
For more help with the terminals, right-click on the function and select Visible Items>>Terminals. The function�s picture will be pulled back to reveal the connection terminals. Notice the colors- these match the data types used by the front panel terminals.
For additional help, select Help>>Show Context Help, or press CTRL+H. This will bring up the context help window. As you move your mouse over the function, this window will show you the function, terminals, and a brief help description. Use this with the other tools to help you as you wire.In addition to Front Panel terminals, the Block diagram contains functions. Each function may have multiple input and output terminals. Wiring to these terminals is an important part of LabVIEW programming.
Once you have some experience programming in LabVIEW, wiring will become easy. At first, you may need some assistance. Here are some tips to get you started:
The wiring tool is used to wire to the nodes of the functions. When you �aim� with the wiring tool, aim with the end of the wire hanging from the spool. This is where the wire will be placed.
As you move the wiring tool over functions, watch for the yellow tip strip. This will tell you the name of the terminal you are wiring to.
As you move the wiring tool over a terminal, it will flash. This will help you identify where the wire will attach.
For more help with the terminals, right-click on the function and select Visible Items>>Terminals. The function�s picture will be pulled back to reveal the connection terminals. Notice the colors- these match the data types used by the front panel terminals.
For additional help, select Help>>Show Context Help, or press CTRL+H. This will bring up the context help window. As you move your mouse over the function, this window will show you the function, terminals, and a brief help description. Use this with the other tools to help you as you wire.
15. Wiring Tips � Block Diagram In addition to Front Panel terminals, the Block diagram contains functions. Each function may have multiple input and output terminals. Wiring to these terminals is an important part of LabVIEW programming.
Once you have some experience programming in LabVIEW, wiring will become easy. At first, you may need some assistance. Here are some tips to get you started:
The wiring tool is used to wire to the nodes of the functions. When you �aim� with the wiring tool, aim with the end of the wire hanging from the spool. This is where the wire will be placed.
As you move the wiring tool over functions, watch for the yellow tip strip. This will tell you the name of the terminal you are wiring to.
As you move the wiring tool over a terminal, it will flash. This will help you identify where the wire will attach.
For more help with the terminals, right-click on the function and select Visible Items>>Terminals. The function�s picture will be pulled back to reveal the connection terminals. Notice the colors- these match the data types used by the front panel terminals.
For additional help, select Help>>Show Context Help, or press CTRL+H. This will bring up the context help window. As you move your mouse over the function, this window will show you the function, terminals, and a brief help description. Use this with the other tools to help you as you wire.
If your wiring becomes doesn�t look very good, right-click on the particular wire in question and choose Clean Up Wire to automatically re-route that wire.
In addition to Front Panel terminals, the Block diagram contains functions. Each function may have multiple input and output terminals. Wiring to these terminals is an important part of LabVIEW programming.
Once you have some experience programming in LabVIEW, wiring will become easy. At first, you may need some assistance. Here are some tips to get you started:
The wiring tool is used to wire to the nodes of the functions. When you �aim� with the wiring tool, aim with the end of the wire hanging from the spool. This is where the wire will be placed.
As you move the wiring tool over functions, watch for the yellow tip strip. This will tell you the name of the terminal you are wiring to.
As you move the wiring tool over a terminal, it will flash. This will help you identify where the wire will attach.
For more help with the terminals, right-click on the function and select Visible Items>>Terminals. The function�s picture will be pulled back to reveal the connection terminals. Notice the colors- these match the data types used by the front panel terminals.
For additional help, select Help>>Show Context Help, or press CTRL+H. This will bring up the context help window. As you move your mouse over the function, this window will show you the function, terminals, and a brief help description. Use this with the other tools to help you as you wire.
If your wiring becomes doesn�t look very good, right-click on the particular wire in question and choose Clean Up Wire to automatically re-route that wire.
16. Wiring is very flexible in LabVIEW. Experiment with keystroke and clicking combinations when wiring. Here are some of the most often used features:
Single, double, and triple clicking a wire selects the wire for movement or deletion
Clicking while wiring tacks down a bend in the wire
Right-clicking or pressing Escape while wiring cancels the wiring operation
Don�t worry about wire colors- LabVIEW will automatically select the right wire for each situation.
Automatically Wiring Objects
LabVIEW automatically wires objects as you place them on the block diagram. You also can automatically wire objects already on the block diagram. LabVIEW connects the terminals that best match and leaves terminals that do not match unconnected. As you move a selected object close to other objects on the block diagram, LabVIEW draws temporary wires to show you valid connections. When you release the mouse button to place the object on the block diagram, LabVIEW automatically connects the wires. Toggle automatic wiring by pressing the spacebar while you move an object using the Positioning tool. You can adjust the automatic wiring settings by selecting Tools � Options and selecting Block Diagram from the top pull-down menu.
Wiring is very flexible in LabVIEW. Experiment with keystroke and clicking combinations when wiring. Here are some of the most often used features:
Single, double, and triple clicking a wire selects the wire for movement or deletion
Clicking while wiring tacks down a bend in the wire
Right-clicking or pressing Escape while wiring cancels the wiring operation
Don�t worry about wire colors- LabVIEW will automatically select the right wire for each situation.
Automatically Wiring Objects
LabVIEW automatically wires objects as you place them on the block diagram. You also can automatically wire objects already on the block diagram. LabVIEW connects the terminals that best match and leaves terminals that do not match unconnected. As you move a selected object close to other objects on the block diagram, LabVIEW draws temporary wires to show you valid connections. When you release the mouse button to place the object on the block diagram, LabVIEW automatically connects the wires. Toggle automatic wiring by pressing the spacebar while you move an object using the Positioning tool. You can adjust the automatic wiring settings by selecting Tools � Options and selecting Block Diagram from the top pull-down menu.
17. LabVIEW follows a dataflow model for running VIs. A block diagram node executes when all its inputs are available. When a node completes execution, it supplies data to its output terminals and passes the output data to the next node in the dataflow path. Visual Basic, C++, JAVA, and most other text-based programming languages follow a control flow model of program execution. In control flow, the sequential order of program elements determines the execution order of a program.
Consider the block diagram above. It adds two numbers and then subtracts 50.0 from the result of the addition. In this case, the block diagram executes from left to right, not because the objects are placed in that order, but because one of the inputs of the Subtract function is not valid until the Add function has finished executing and passed the data to the Subtract function. Remember that a node executes only when data are available at all of its input terminals, and it supplies data to its output terminals only when it finishes execution.
In the code to the right, consider which code segment would execute first�the Add, Random Number, or Divide function. You cannot know because inputs to the Add and Divide functions are available at the same time, and the Random Number function has no inputs. In a situation where one code segment must execute before another, and no data dependency exists between the functions, use a Sequence structure to force the order of execution.LabVIEW follows a dataflow model for running VIs. A block diagram node executes when all its inputs are available. When a node completes execution, it supplies data to its output terminals and passes the output data to the next node in the dataflow path. Visual Basic, C++, JAVA, and most other text-based programming languages follow a control flow model of program execution. In control flow, the sequential order of program elements determines the execution order of a program.
Consider the block diagram above. It adds two numbers and then subtracts 50.0 from the result of the addition. In this case, the block diagram executes from left to right, not because the objects are placed in that order, but because one of the inputs of the Subtract function is not valid until the Add function has finished executing and passed the data to the Subtract function. Remember that a node executes only when data are available at all of its input terminals, and it supplies data to its output terminals only when it finishes execution.
In the code to the right, consider which code segment would execute first�the Add, Random Number, or Divide function. You cannot know because inputs to the Add and Divide functions are available at the same time, and the Random Number function has no inputs. In a situation where one code segment must execute before another, and no data dependency exists between the functions, use a Sequence structure to force the order of execution.
18. Help Options Use the Context Help window and the LabVIEW Help to help you build and edit VIs. Refer to the LabVIEW Help and manuals for more information.
Context Help Window
To display the Context Help window, select Help�Show Context Help or press the <Ctrl-H> keys. When you move the cursor over front panel and block diagram objects, the Context Help window displays the icon for subVIs, functions, constants, controls, and indicators, with wires attached to each terminal. When you move the cursor over dialog box options, the Context Help window displays descriptions of those options. In the window, required connections are bold, recommended connections are plain text, and optional connections are dimmed or do not appear. Above is an example Context Help window.
Click the Simple/Detailed Context Help button located on the lower left corner of the Context Help window to change between simple and detailed context help. The simple mode emphasizes the important connections. Optional terminals are shown by wire stubs, informing you that other connections exist.
Click the Lock Context Help button to lock the current contents of the Context Help window. When the contents are locked, moving the cursor over another object does not change the contents of the window. To unlock the window, click the button again. You also can access this option from the Help menu.Use the Context Help window and the LabVIEW Help to help you build and edit VIs. Refer to the LabVIEW Help and manuals for more information.
Context Help Window
To display the Context Help window, select Help�Show Context Help or press the <Ctrl-H> keys. When you move the cursor over front panel and block diagram objects, the Context Help window displays the icon for subVIs, functions, constants, controls, and indicators, with wires attached to each terminal. When you move the cursor over dialog box options, the Context Help window displays descriptions of those options. In the window, required connections are bold, recommended connections are plain text, and optional connections are dimmed or do not appear. Above is an example Context Help window.
Click the Simple/Detailed Context Help button located on the lower left corner of the Context Help window to change between simple and detailed context help. The simple mode emphasizes the important connections. Optional terminals are shown by wire stubs, informing you that other connections exist.
Click the Lock Context Help button to lock the current contents of the Context Help window. When the contents are locked, moving the cursor over another object does not change the contents of the window. To unlock the window, click the button again. You also can access this option from the Help menu.
19. Click the More Help button to display the corresponding topic in the LabVIEW Help, which describes the object in detail.
LabVIEW Help
You can access the LabVIEW Help either by clicking the More Help button in the Context Help window, selecting Help�VI, Function, & How-To Help, clicking the sentence Click here for more help in the Context Help window, or pressing <Ctrl-?>.
The LabVIEW Help contains detailed descriptions of most palettes, menus, tools, VIs, and functions. It also includes step-by-step instructions for using LabVIEW features and links to the LabVIEW Tutorial, PDF versions of all the LabVIEW manuals and Application Notes, and technical support resources on the National Instruments Web site.
Click the More Help button to display the corresponding topic in the LabVIEW Help, which describes the object in detail.
LabVIEW Help
You can access the LabVIEW Help either by clicking the More Help button in the Context Help window, selecting Help�VI, Function, & How-To Help, clicking the sentence Click here for more help in the Context Help window, or pressing <Ctrl-?>.
The LabVIEW Help contains detailed descriptions of most palettes, menus, tools, VIs, and functions. It also includes step-by-step instructions for using LabVIEW features and links to the LabVIEW Tutorial, PDF versions of all the LabVIEW manuals and Application Notes, and technical support resources on the National Instruments Web site.
20. Exercise 1 - Convert �C to �F Estimate completion time: 20 minutes. The exercise is easy, but since it will be the first VI that we actually create, it is good to allow ample time to explore the LabVIEW environment.
Instructions: Build a VI that converts �C to �F. When run, the VI should take an input value (�C), multiply it by 1.8, add 32, and display the result (�F). The front panel should display both the input value and the result. Save the VI as Convert C to F.vi.Estimate completion time: 20 minutes. The exercise is easy, but since it will be the first VI that we actually create, it is good to allow ample time to explore the LabVIEW environment.
Instructions: Build a VI that converts �C to �F. When run, the VI should take an input value (�C), multiply it by 1.8, add 32, and display the result (�F). The front panel should display both the input value and the result. Save the VI as Convert C to F.vi.
21. Debugging Techniques When your VI is not executable, a broken arrow is displayed in the Run button in the palette.
Finding Errors: To list errors, click on the broken arrow. To locate the bad object, click on the error message.
Execution Highlighting: Animates the diagram and traces the flow of the data, allowing you to view intermediate values.
Click on the light bulb on the toolbar.
Probe: Used to view values in arrays and clusters.
Click on wires with the Probe tool or right-click on the wire to set probes.
Breakpoint: Set pauses at different locations on the diagram.
Click on wires or objects with the Breakpoint tool to set breakpoints.
Use Debug Demonstrate VI from BASICS.LLB to demonstrate the options and tools.
When your VI is not executable, a broken arrow is displayed in the Run button in the palette.
Finding Errors: To list errors, click on the broken arrow. To locate the bad object, click on the error message.
Execution Highlighting: Animates the diagram and traces the flow of the data, allowing you to view intermediate values.
Click on the light bulb on the toolbar.
Probe: Used to view values in arrays and clusters.
Click on wires with the Probe tool or right-click on the wire to set probes.
Breakpoint: Set pauses at different locations on the diagram.
Click on wires or objects with the Breakpoint tool to set breakpoints.
Use Debug Demonstrate VI from BASICS.LLB to demonstrate the options and tools.
22. Section II � SubVIs What is a subVI?
Making an icon and connector for a subVI
Using a VI as a subVI
23. Block Diagram Nodes Just as control or indicator terminals on the block diagram can be viewed as an icon or a simple terminal, subVIs can be viewed as an icon, an expandable node, or an expanded node. The different views merely depend on user preference and do not change the functionality of the subVI.Just as control or indicator terminals on the block diagram can be viewed as an icon or a simple terminal, subVIs can be viewed as an icon, an expandable node, or an expanded node. The different views merely depend on user preference and do not change the functionality of the subVI.
24. SubVIs A SubVI is a VI that can be used within another VI
Similar to a subroutine
Advantages
Modular
Easier to debug
Don�t have to recreate code
Require less memory After you build a VI and create its icon and connector pane, you can use it in another VI. A VI within another VI is called a subVI. A subVI corresponds to a subroutine in text-based programming languages. Using subVIs helps you manage changes and debug the block diagram quickly.After you build a VI and create its icon and connector pane, you can use it in another VI. A VI within another VI is called a subVI. A subVI corresponds to a subroutine in text-based programming languages. Using subVIs helps you manage changes and debug the block diagram quickly.
25. Icon and Connector An icon represents a VI in other block diagrams
A connector shows available terminals for data transfer
Every VI displays an icon, shown above, in the upper right corner of the front panel and block diagram windows. An icon is a graphical representation of a VI. It can contain text, images, or a combination of both. If you use a VI as a subVI, the icon identifies the subVI on the block diagram of the VI.
The connector shows terminals available for transfer or data to and from the subVI. There are several connector patterns to choose from. Right click on the connector and select the pattern from the Patterns menu. From there you can assign controls and indicators on the front panel to the connector terminal, as we will see later.
26. SubVIs The above block diagram contains two subVIs. To see the front panel of a subVI, simply double click the subVI. You can also view the hierarchy of subVIs within a top level VI by clicking on Browse � Show VI Hierarchy.The above block diagram contains two subVIs. To see the front panel of a subVI, simply double click the subVI. You can also view the hierarchy of subVIs within a top level VI by clicking on Browse � Show VI Hierarchy.
27. Steps to Create a SubVI Create the Icon
Create the Connector
Assign Terminals
Save the VI
Insert the VI into a Top Level VI
28. Create the Icon Right-click on the icon in the block diagram or front panel Create custom icons to replace the default icon by right-clicking the icon in the upper right corner of the front panel or block diagram and selecting Edit Icon from the shortcut menu or by double-clicking the icon in the upper right corner of the front panel. You also can edit icons by selecting File�VI Properties, selecting General from the Category pull-down menu, and clicking the Edit Icon button. Use the tools on the left side of the Icon Editor dialog box to create the icon design in the editing area. The normal size image of the icon appears in the appropriate box to the right of the editing area.
You also can drag a graphic from anywhere in your file system and drop it in the upper right corner of the front panel or block diagram. LabVIEW converts the graphic to a 32 � 32 pixel icon.
Create custom icons to replace the default icon by right-clicking the icon in the upper right corner of the front panel or block diagram and selecting Edit Icon from the shortcut menu or by double-clicking the icon in the upper right corner of the front panel. You also can edit icons by selecting File�VI Properties, selecting General from the Category pull-down menu, and clicking the Edit Icon button. Use the tools on the left side of the Icon Editor dialog box to create the icon design in the editing area. The normal size image of the icon appears in the appropriate box to the right of the editing area.
You also can drag a graphic from anywhere in your file system and drop it in the upper right corner of the front panel or block diagram. LabVIEW converts the graphic to a 32 � 32 pixel icon.
29. Create the Connector To use a VI as a subVI, you need to build a connector pane. The connector pane is a set of terminals that corresponds to the controls and indicators of that VI, similar to the parameter list of a function call in text-based programming languages. The connector pane defines the inputs and outputs you can wire to the VI so you can use it as a subVI.
Define connections by assigning a front panel control or indicator to each of the connector pane terminals. To define a connector pane, right-click the icon in the upper right corner of the front panel window and select Show Connector from the shortcut menu. The connector pane replaces the icon. Each rectangle on the connector pane represents a terminal. Use the rectangles to assign inputs and outputs. The number of terminals LabVIEW displays on the connector pane depends on the number of controls and indicators on the front panel. The above front panel has four controls and one indicator, so LabVIEW displays four input terminals and one output terminal on the connector pane.To use a VI as a subVI, you need to build a connector pane. The connector pane is a set of terminals that corresponds to the controls and indicators of that VI, similar to the parameter list of a function call in text-based programming languages. The connector pane defines the inputs and outputs you can wire to the VI so you can use it as a subVI.
Define connections by assigning a front panel control or indicator to each of the connector pane terminals. To define a connector pane, right-click the icon in the upper right corner of the front panel window and select Show Connector from the shortcut menu. The connector pane replaces the icon. Each rectangle on the connector pane represents a terminal. Use the rectangles to assign inputs and outputs. The number of terminals LabVIEW displays on the connector pane depends on the number of controls and indicators on the front panel. The above front panel has four controls and one indicator, so LabVIEW displays four input terminals and one output terminal on the connector pane.
30. Assign Terminals After you select a pattern to use for your connector pane, you must define connections by assigning a front panel control or indicator to each of the connector pane terminals. When you link controls and indicators to the connector pane, place inputs on the left and outputs on the right to prevent complicated, unclear wiring patterns in your VIs. To assign a terminal to a front panel control or indicator, click a terminal of the connector pane. Click the front panel control or indicator you want to assign to the terminal. Click an open area of the front panel. The terminal changes to the data type color of the control to indicate that you connected the terminal. You also can select the control or indicator first and then select the terminal.
Make sure you save the VI after you have made the terminal assignments.After you select a pattern to use for your connector pane, you must define connections by assigning a front panel control or indicator to each of the connector pane terminals. When you link controls and indicators to the connector pane, place inputs on the left and outputs on the right to prevent complicated, unclear wiring patterns in your VIs. To assign a terminal to a front panel control or indicator, click a terminal of the connector pane. Click the front panel control or indicator you want to assign to the terminal. Click an open area of the front panel. The terminal changes to the data type color of the control to indicate that you connected the terminal. You also can select the control or indicator first and then select the terminal.
Make sure you save the VI after you have made the terminal assignments.
31. Save The VI Choose an Easy to Remember Location
Organize by Functionality
Save Similar VIs into one directory (e.g. Math Utilities)
Organize by Application
Save all VIs Used for a Specific Application into one directory or library file (e.g. Lab 1 � Frequency Response)
Library Files (.llbs) combine many VI�s into a single file, ideal for transferring entire applications across computers
There are several ways to organize your subVIs. The most common way is to organize by application. In this case, all the VI�s for a particular application are saved into the same directory or into a VI Library file. Saving into a library file allows you to transport an entire application within a single file.
Saving into library is simple. After clicking Save As�, click New VI Library. This will allow you to name the library, and then save your VI into it. To add subsequent VI�s, simply double click the .llb file from the standard Save window, and give the VI a name.
32. Insert the SubVI into a Top Level VI After you build a VI and create its icon and connector pane, you can use it as a subVI. To place a subVI on the block diagram, select Functions�Select a VI. Navigate to and double-click the VI you want to use as a subVI and place it on the block diagram.
You also can place an open VI on the block diagram of another open VI by using the Positioning tool to click the icon in the upper right corner of the front panel or block diagram of the VI you want to use as a subVI and drag the icon to the block diagram of the other VI.After you build a VI and create its icon and connector pane, you can use it as a subVI. To place a subVI on the block diagram, select Functions�Select a VI. Navigate to and double-click the VI you want to use as a subVI and place it on the block diagram.
You also can place an open VI on the block diagram of another open VI by using the Positioning tool to click the icon in the upper right corner of the front panel or block diagram of the VI you want to use as a subVI and drag the icon to the block diagram of the other VI.
33. Tips for Working in LabVIEW Keystroke Shortcuts
<Ctrl-H> � Activate/Deactivate Context Help Window
<Ctrl-B> � Remove Broken Wires From Block Diagram
<Ctrl-E> � Toggle Between Front Panel and Block Diagram
<Ctrl-Z> � Undo (Also in Edit Menu)
Tools � Options� � Set Preferences in LabVIEW
VI Properties � Configure VI Appearance, Documentation, etc. LabVIEW has many keystroke shortcuts that make working easier. The most common shortcuts are listed above.
While the Automatic Selection Tool is great for choosing the tool you would like to use in LabVIEW, there are sometimes cases when you want manual control. Use the Tab key to toggle between the four most common tools (Operate Value, Position/Size/Select, Edit Text, Set Color on Front Panel and Operate Value, Position/Size/Select, Edit Text, Connect Wire on Block Diagram). Once you are finished with the tool you choose, you can press <Shift-Tab> to turn the Automatic Selection Tool on.
In the Tools � Options� dialog, there are many configurable options for customizing your Front Panel, Block Diagram, Colors, Printing, and much more.
Similar to the LabVIEW Options, you can configure VI specific properties by going to File � VI Properties� There you can document the VI, change the appearance of the window, and customize it in several other ways.LabVIEW has many keystroke shortcuts that make working easier. The most common shortcuts are listed above.
While the Automatic Selection Tool is great for choosing the tool you would like to use in LabVIEW, there are sometimes cases when you want manual control. Use the Tab key to toggle between the four most common tools (Operate Value, Position/Size/Select, Edit Text, Set Color on Front Panel and Operate Value, Position/Size/Select, Edit Text, Connect Wire on Block Diagram). Once you are finished with the tool you choose, you can press <Shift-Tab> to turn the Automatic Selection Tool on.
In the Tools � Options� dialog, there are many configurable options for customizing your Front Panel, Block Diagram, Colors, Printing, and much more.
Similar to the LabVIEW Options, you can configure VI specific properties by going to File � VI Properties� There you can document the VI, change the appearance of the window, and customize it in several other ways.
34. Section III � Data Acquisition Data acquisition (DAQ) basics
Connecting Signals
Simple DAQ application
35. DAQ � Data Acquisition Temperature Acquisition using the DAQ Assistant
Above is the DAQ Assistant window that can be quickly configured to read temperature from a Data Acquisition (DAQ) board.Above is the DAQ Assistant window that can be quickly configured to read temperature from a Data Acquisition (DAQ) board.
36. Data Acquisition Terminology Resolution - Determines How Many Different Voltage Changes Can Be Measured
Larger Resolution ? More Precise Representation of Signal
Range - Minimum and Maximum Voltages
Smaller range ? More Precise Representation of Signal
Gain - Amplifies or Attenuates Signal for Best Fit in Range Resolution: When acquiring data to a computer, an Analog-to-Digital Converter (ADC) takes an analog signal and turns it into a binary number. Therefore, each binary number from the ADC represents a certain voltage level. The ADC returns the highest possible level without going over the actual voltage level of the analog signal. Resolution refers to the number of binary levels the ADC can use to represent a signal. To figure out the number of binary levels available based on the resolution you simply take 2Resolution. Therefore, the higher the resolution, the more levels you will have to represent your signal. For instance, an ADC with 3-bit resolution can measure 23 or 8 voltage levels, while an ADC with 12-bit resolution can measure 212 or 4096 voltage levels.
Range: Unlike the resolution of the ADC, the range of the ADC is selectable. Most DAQ devices offer a range from 0 - +10 or -10 to +10. The range is chosen when you configure your device in NI-DAQ. Keep in mind that the resolution of the ADC will be spread over whatever range you choose. The larger the range, the more spread out your resolution will be, and you will get a worse representation of your signal. Thus it is important to pick your range to properly fit your input signal.
Resolution: When acquiring data to a computer, an Analog-to-Digital Converter (ADC) takes an analog signal and turns it into a binary number. Therefore, each binary number from the ADC represents a certain voltage level. The ADC returns the highest possible level without going over the actual voltage level of the analog signal. Resolution refers to the number of binary levels the ADC can use to represent a signal. To figure out the number of binary levels available based on the resolution you simply take 2Resolution. Therefore, the higher the resolution, the more levels you will have to represent your signal. For instance, an ADC with 3-bit resolution can measure 23 or 8 voltage levels, while an ADC with 12-bit resolution can measure 212 or 4096 voltage levels.
Range: Unlike the resolution of the ADC, the range of the ADC is selectable. Most DAQ devices offer a range from 0 - +10 or -10 to +10. The range is chosen when you configure your device in NI-DAQ. Keep in mind that the resolution of the ADC will be spread over whatever range you choose. The larger the range, the more spread out your resolution will be, and you will get a worse representation of your signal. Thus it is important to pick your range to properly fit your input signal.
37. Gain: Properly choosing the range of your ADC is one way to make sure you are maximizing the resolution of your ADC. Another way to help your signal maximize the resolution of the ADC is by applying a gain. Gain refers to any amplification or attenuation of a signal. The gain setting is a scaling factor. Each voltage level on your incoming signal is multiplied by the gain setting to achieve the amplified or attenuated signal. Unlike resolution that is a fixed setting of the ADC, and range that is chosen when the DAQ device is configured, the gain is specified indirectly through a setting called input limits. Input limits refers to the minimum and maximum values of your actual analog input signal. Based on the input limits you set, the largest possible gain is applied to your signal that will keep the signal within the chosen range of the ADC. So instead of needing to calculate the best gain based on your signal and the chosen range, all you need to know is the minimum and maximum values of your signal.
Gain: Properly choosing the range of your ADC is one way to make sure you are maximizing the resolution of your ADC. Another way to help your signal maximize the resolution of the ADC is by applying a gain. Gain refers to any amplification or attenuation of a signal. The gain setting is a scaling factor. Each voltage level on your incoming signal is multiplied by the gain setting to achieve the amplified or attenuated signal. Unlike resolution that is a fixed setting of the ADC, and range that is chosen when the DAQ device is configured, the gain is specified indirectly through a setting called input limits. Input limits refers to the minimum and maximum values of your actual analog input signal. Based on the input limits you set, the largest possible gain is applied to your signal that will keep the signal within the chosen range of the ADC. So instead of needing to calculate the best gain based on your signal and the chosen range, all you need to know is the minimum and maximum values of your signal.
38. Hardware Connections There are many different hardware setups possible when acquiring data. All Data Acquisition systems require some sort of connection terminal that accepts a signal from your transducer and transmits it to the DAQ card. Four such terminal blocks are the BNC-2120, SC-2075, SCB-68, and NI-ELVIS.
The BNC-2120 is a shielded connector block with signal-labeled BNC connectors for easy connectivity to your DAQ device. It also provides a function generator, quadrature encoder, temperature reference, thermocouple connector, and LED so that you can test the functionality of your hardware.
The SC-2075 provides breadboard area for prototyping and BNC and spring terminal connectivity. The built-in �15 V or adjustable 0 to 5 V power supply and LED�s make the SC-2075 ideal for academic laboratories.
The SCB-68 is a shielded I/O connector block for rugged, very low-noise signal termination. It includes general-purpose breadboard areas (two) as well as an IC temperature sensor for cold-junction compensation in temperature measurements.
NI-ELVIS (Educational Laboratory Virtual Instrumentation Suite) is a LabVIEW-based design and prototyping environment and consists of LabVIEW-based virtual instruments, a multifunction data acquisition device, and a custom-designed bench-top workstation and prototyping board.
There are many different hardware setups possible when acquiring data. All Data Acquisition systems require some sort of connection terminal that accepts a signal from your transducer and transmits it to the DAQ card. Four such terminal blocks are the BNC-2120, SC-2075, SCB-68, and NI-ELVIS.
The BNC-2120 is a shielded connector block with signal-labeled BNC connectors for easy connectivity to your DAQ device. It also provides a function generator, quadrature encoder, temperature reference, thermocouple connector, and LED so that you can test the functionality of your hardware.
The SC-2075 provides breadboard area for prototyping and BNC and spring terminal connectivity. The built-in �15 V or adjustable 0 to 5 V power supply and LED�s make the SC-2075 ideal for academic laboratories.
The SCB-68 is a shielded I/O connector block for rugged, very low-noise signal termination. It includes general-purpose breadboard areas (two) as well as an IC temperature sensor for cold-junction compensation in temperature measurements.
NI-ELVIS (Educational Laboratory Virtual Instrumentation Suite) is a LabVIEW-based design and prototyping environment and consists of LabVIEW-based virtual instruments, a multifunction data acquisition device, and a custom-designed bench-top workstation and prototyping board.
39. Exercise 2 � Simple Data Acquisition Complete Convert C to F.vi, then create Thermometer.vi. Note: To complete this exercise, you will need the IC temperature sensor available on either the BNC-2120, SCB-68 or DAQ Signal Accessory.
Estimated completion time: 30 minutes.
Instructions: This exercise has three parts.
First, create an icon and connector for Convert C to F.vi (Exercise 1). The icon should remind you of the functionality of the VI (e.g. C?F or CtoF). The connector should have one input and one output, allowing a terminal for �C in, and �F out.
Second, create a top level VI that acquires a data point from channel 0 (the temperature sensor) of your DAQ board and allows the user to display the temperature in Celsius or Fahrenheit. To do this you will need to acquire a single data point from your DAQ board and scale it by a factor of 100. This will give you �C. You should have a Boolean switch or button that allows the user to select Celsius or Fahrenheit. If the user selects Celsius, the scaled value should be displayed in a thermometer indicator. If the user selects Fahrenheit, the Celsius value should be passed into Convert C to F.vi (used as a subVI), and the output Fahrenheit value should be displayed.
Hint: Use the Select function in the Comparison palette.Note: To complete this exercise, you will need the IC temperature sensor available on either the BNC-2120, SCB-68 or DAQ Signal Accessory.
Estimated completion time: 30 minutes.
Instructions: This exercise has three parts.
First, create an icon and connector for Convert C to F.vi (Exercise 1). The icon should remind you of the functionality of the VI (e.g. C?F or CtoF). The connector should have one input and one output, allowing a terminal for �C in, and �F out.
Second, create a top level VI that acquires a data point from channel 0 (the temperature sensor) of your DAQ board and allows the user to display the temperature in Celsius or Fahrenheit. To do this you will need to acquire a single data point from your DAQ board and scale it by a factor of 100. This will give you �C. You should have a Boolean switch or button that allows the user to select Celsius or Fahrenheit. If the user selects Celsius, the scaled value should be displayed in a thermometer indicator. If the user selects Fahrenheit, the Celsius value should be passed into Convert C to F.vi (used as a subVI), and the output Fahrenheit value should be displayed.
Hint: Use the Select function in the Comparison palette.
40. Finally, create an Icon and Connector for Thermometer.vi. One possible Icon would be a picture of a thermometer. The connector should have two terminals. One for the Boolean input (�C or �F), and the second for the scaled temperature output. Save the VI as Thermometer.vi.
Finally, create an Icon and Connector for Thermometer.vi. One possible Icon would be a picture of a thermometer. The connector should have two terminals. One for the Boolean input (�C or �F), and the second for the scaled temperature output. Save the VI as Thermometer.vi.
41. Section IV � Loops and Charts For Loop
While Loop
Charts
Multiplots
42. Loops While Loops
Have Iteration Terminal
Always Run at least Once
Run According to Conditional Terminal Both the While and For Loops are located on the Functions�Structures palette. The For Loop differs from the While Loop in that the For Loop executes a set number of times. A While Loop stops executing the subdiagram only if the value at the conditional terminal exists.
While Loops
Similar to a Do Loop or a Repeat-Until Loop in text-based programming languages, a While Loop, shown at the top right, executes a subdiagram until a condition is met. The While Loop executes the sub diagram until the conditional terminal, an input terminal, receives a specific Boolean value. The default behavior and appearance of the conditional terminal is Continue If True, shown at left. When a conditional terminal is Continue If True, the While Loop executes its subdiagram until the conditional terminal receives a FALSE value. The iteration terminal (an output terminal), shown at left, contains the number of completed iterations. The iteration count always starts at zero. During the first iteration, the iteration terminal returns 0.
For Loops
A For Loop, shown at left, executes a subdiagram a set number of times. The value in the count terminal (an input terminal) represented by the N, indicates how many times to repeat the subdiagram. The iteration terminal (an output terminal), shown at left, contains the number of completed iterations. The iteration count always starts at zero. During the first iteration, the iteration terminal returns 0.
Both the While and For Loops are located on the Functions�Structures palette. The For Loop differs from the While Loop in that the For Loop executes a set number of times. A While Loop stops executing the subdiagram only if the value at the conditional terminal exists.
While Loops
Similar to a Do Loop or a Repeat-Until Loop in text-based programming languages, a While Loop, shown at the top right, executes a subdiagram until a condition is met. The While Loop executes the sub diagram until the conditional terminal, an input terminal, receives a specific Boolean value. The default behavior and appearance of the conditional terminal is Continue If True, shown at left. When a conditional terminal is Continue If True, the While Loop executes its subdiagram until the conditional terminal receives a FALSE value. The iteration terminal (an output terminal), shown at left, contains the number of completed iterations. The iteration count always starts at zero. During the first iteration, the iteration terminal returns 0.
For Loops
A For Loop, shown at left, executes a subdiagram a set number of times. The value in the count terminal (an input terminal) represented by the N, indicates how many times to repeat the subdiagram. The iteration terminal (an output terminal), shown at left, contains the number of completed iterations. The iteration count always starts at zero. During the first iteration, the iteration terminal returns 0.
43. Place loops in your diagram by selecting them from the Structures palette of the Functions palette (demonstrate):
When selected, the mouse cursor becomes a special pointer that you use to enclose the section of code you want to repeat.
Click the mouse button to define the top-left corner, click the mouse button again at the bottom-right corner, and the While Loop boundary is created around the selected code.
Drag or drop additional nodes in the While Loop if needed.Place loops in your diagram by selecting them from the Structures palette of the Functions palette (demonstrate):
When selected, the mouse cursor becomes a special pointer that you use to enclose the section of code you want to repeat.
Click the mouse button to define the top-left corner, click the mouse button again at the bottom-right corner, and the While Loop boundary is created around the selected code.
Drag or drop additional nodes in the While Loop if needed.
44. Charts Waveform chart � special numeric indicator that can display a history of values
Controls >> Graph Indicators >> Waveform Chart The waveform chart is a special numeric indicator that displays one or more plots. The waveform chart is located on the Controls�Graph Indicators palette. Waveform charts can display single or multiple plots. The following front panel shows an example of a multi-plot waveform chart.
You can change the min and max values of either the x or y axis by double clicking on the value with the labeling tool and typing the new value. Similarly, you can change the label of the axis. You can also right click the plot legend and change the style, shape, and color of the trace that is displayed on the chart.
The waveform chart is a special numeric indicator that displays one or more plots. The waveform chart is located on the Controls�Graph Indicators palette. Waveform charts can display single or multiple plots. The following front panel shows an example of a multi-plot waveform chart.
You can change the min and max values of either the x or y axis by double clicking on the value with the labeling tool and typing the new value. Similarly, you can change the label of the axis. You can also right click the plot legend and change the style, shape, and color of the trace that is displayed on the chart.
45. Wiring Data into Charts Single Plot Charts Multiplot Charts You can wire a scalar output directly to a waveform chart to display one plot. To display multiple plots on one chart, use the Merge Signals function found in the Functions >> Signal Manipulation palette. The Merge Signal function bundles multiple outputs to plot on the waveform chart. To add more plots, use the Positioning tool to resize the Merge Signal function.
The context help contains very good information on how the different ways to wire data into charts.You can wire a scalar output directly to a waveform chart to display one plot. To display multiple plots on one chart, use the Merge Signals function found in the Functions >> Signal Manipulation palette. The Merge Signal function bundles multiple outputs to plot on the waveform chart. To add more plots, use the Positioning tool to resize the Merge Signal function.
The context help contains very good information on how the different ways to wire data into charts.
46. Exercise 3 � Using loops Students build Use a loop.vi. This exercise should take 15-20 minutes.
Instructions:
Create a VI that generates a random number at a specified rate and displays the readings on a Waveform Chart until stopped by the user. Connect the termination terminal to a front panel stop button, and add a slider control to the front panel. The slider control should range from 0 to 2000 in value, and be connected to the Time Delay Express VI function inside your while loop. Save the VI as Use a loop.vi.This exercise should take 15-20 minutes.
Instructions:
Create a VI that generates a random number at a specified rate and displays the readings on a Waveform Chart until stopped by the user. Connect the termination terminal to a front panel stop button, and add a slider control to the front panel. The slider control should range from 0 to 2000 in value, and be connected to the Time Delay Express VI function inside your while loop. Save the VI as Use a loop.vi.
47. Section V � Arrays & File I/O Build arrays manually
Have LabVIEW build arrays automatically
Write to a spreadsheet file
Read from a spreadsheet file Arrays group data elements of the same type. An array consists of elements and dimensions. Elements are the data that make up the array. A dimension is the length, height, or depth of an array. An array can have one or more dimensions and as many as 2^31 � 1 elements per dimension, memory permitting.
You can build arrays of numeric, Boolean, path, string, waveform, and cluster data types. Consider using arrays when you work with a collection of similar data and when you perform repetitive computations. Arrays are ideal for storing data you collect from waveforms or data generated in loops, where each iteration of a loop produces one element of the array.
Array elements are ordered. An array uses an index so you can readily access any particular element. The index is zero-based, which means it is in the range 0 to n � 1, where n is the number of elements in the array. For example, n = 9 for the nine planets, so the index ranges from 0 to 8. Earth is the third planet, so it has an index of 2.
File I/O operations pass data to and from files. Use the File I/O VIs and functions located on the Functions � File I/O palette to handle all aspects of file I/O. In this class we will cover reading and writing spreadsheet files using the Express VIs for File I/O.
Arrays group data elements of the same type. An array consists of elements and dimensions. Elements are the data that make up the array. A dimension is the length, height, or depth of an array. An array can have one or more dimensions and as many as 2^31 � 1 elements per dimension, memory permitting.
You can build arrays of numeric, Boolean, path, string, waveform, and cluster data types. Consider using arrays when you work with a collection of similar data and when you perform repetitive computations. Arrays are ideal for storing data you collect from waveforms or data generated in loops, where each iteration of a loop produces one element of the array.
Array elements are ordered. An array uses an index so you can readily access any particular element. The index is zero-based, which means it is in the range 0 to n � 1, where n is the number of elements in the array. For example, n = 9 for the nine planets, so the index ranges from 0 to 8. Earth is the third planet, so it has an index of 2.
File I/O operations pass data to and from files. Use the File I/O VIs and functions located on the Functions � File I/O palette to handle all aspects of file I/O. In this class we will cover reading and writing spreadsheet files using the Express VIs for File I/O.
48. Adding an Array to the Front Panel From the Controls >> All Controls >> Array and Cluster subpalette, select the Array Shell To create an array control or indicator as shown, select an array on the Controls�All Controls�Array & Cluster palette, place it on the front panel, and drag a control or indicator into the array shell. If you attempt to drag an invalid control or indicator such as an XY graph into the array shell, you are unable to drop the control or indicator in the array shell.
You must insert an object in the array shell before you use the array on the block diagram. Otherwise, the array terminal appears black with an empty bracket.
To create an array control or indicator as shown, select an array on the Controls�All Controls�Array & Cluster palette, place it on the front panel, and drag a control or indicator into the array shell. If you attempt to drag an invalid control or indicator such as an XY graph into the array shell, you are unable to drop the control or indicator in the array shell.
You must insert an object in the array shell before you use the array on the block diagram. Otherwise, the array terminal appears black with an empty bracket.
49. Adding an Array (cont.) Place data object into shell (i.e. Numeric Control) To add dimensions to an array one at a time, right-click the index display and select Add Dimension from the shortcut menu. You also can use the Positioning tool to resize the index display until you have as many dimensions as you want.
To add dimensions to an array one at a time, right-click the index display and select Add Dimension from the shortcut menu. You also can use the Positioning tool to resize the index display until you have as many dimensions as you want.
50. Creating an Array with a Loop Loops accumulate arrays at their boundaries If you wire an array to a For Loop or While Loop input tunnel, you can read and process every element in that array by enabling auto-indexing. When you auto-index an array output tunnel, the output array receives a new element from every iteration of the loop. The wire from the output tunnel to the array indicator becomes thicker as it changes to an array at the loop border, and the output tunnel contains square brackets representing an array, as shown in the following illustration.
Disable auto-indexing by right-clicking the tunnel and selecting Disable Indexing from the shortcut menu. For example, disable auto-indexing if you need only the last value passed to the tunnel in the previous example, without creating an array.
Note Because you can use For Loops to process arrays an element at a time, LabVIEW enables auto-indexing by default for every array you wire to a For Loop. Auto-indexing for While Loops is disabled by default. To enable auto-indexing, right-click a tunnel and select Enable Indexing from the shortcut menu.
If you enable auto-indexing on an array wired to a For Loop input terminal, LabVIEW sets the count terminal to the array size so you do not need to wire the count terminal. If you enable auto-indexing for more than one tunnel or if you wire the count terminal, the count becomes the smaller of the choices. For example, if you wire an array with 10 elements to a For Loop input tunnel and you set the count terminal to 15, the loop executes 10 times.
If you wire an array to a For Loop or While Loop input tunnel, you can read and process every element in that array by enabling auto-indexing. When you auto-index an array output tunnel, the output array receives a new element from every iteration of the loop. The wire from the output tunnel to the array indicator becomes thicker as it changes to an array at the loop border, and the output tunnel contains square brackets representing an array, as shown in the following illustration.
Disable auto-indexing by right-clicking the tunnel and selecting Disable Indexing from the shortcut menu. For example, disable auto-indexing if you need only the last value passed to the tunnel in the previous example, without creating an array.
Note Because you can use For Loops to process arrays an element at a time, LabVIEW enables auto-indexing by default for every array you wire to a For Loop. Auto-indexing for While Loops is disabled by default. To enable auto-indexing, right-click a tunnel and select Enable Indexing from the shortcut menu.
If you enable auto-indexing on an array wired to a For Loop input terminal, LabVIEW sets the count terminal to the array size so you do not need to wire the count terminal. If you enable auto-indexing for more than one tunnel or if you wire the count terminal, the count becomes the smaller of the choices. For example, if you wire an array with 10 elements to a For Loop input tunnel and you set the count terminal to 15, the loop executes 10 times.
51. Creating 2D Arrays You can use two For Loops, one inside the other, to create a 2D array. The outer For Loop creates the row elements, and the inner For Loop creates the column elements.
You can use two For Loops, one inside the other, to create a 2D array. The outer For Loop creates the row elements, and the inner For Loop creates the column elements.
52. File I/O File I/O � passing data to and from files
- Files can be binary, text, or spreadsheet
- Write/Read LabVIEW Measurements file (*.lvm)
File I/O operations pass data to and from files. In LabVIEW, you can use File I/O functions to:
Open and close data files
Read data from and write data to files
Read from and writ to spreadsheet-formatted files
Move and rename files and directories
Change file characteristics
Create, modify, and read a configuration file
Write to or read from LabVIEW Measurements files.
In this course we will examine how to write to or read from LabVIEW Measurements files (*.lvm files).
53. Write LabVIEW Measurement File Includes the open, write, close and error handling functions
Handles formatting the string with either a tab or comma delimiter
Merge Signals function is used to combine data into the dynamic data type The Write LVM file can write to spreadsheet files. However, its main purpose is for logging data, that will be used in LabVIEW. This VI creates a .lvm file which can be opened in a spreadsheet application. For simple spreadsheet files, use the Express VIs: Write LVM and Read LVM.The Write LVM file can write to spreadsheet files. However, its main purpose is for logging data, that will be used in LabVIEW. This VI creates a .lvm file which can be opened in a spreadsheet application. For simple spreadsheet files, use the Express VIs: Write LVM and Read LVM.
54. Exercise 4 � Analyzing and Logging Data Students build Temperature Logger.vi Estimated completion time: 30-45 minutes.
Instructions:
Create a VI that acquires and displays temperature data at a fixed rate until stopped by the user. If you have completed Exercise 2 and have a DAQ card, use Thermometer.vi to obtain your data. If you have not completed the exercise or do not have a DAQ card, you can use the Digital Thermometer.vi from the Tutorial subpalette of the functions palette.
Once stopped, the VI should perform analysis on the data it collected while running. Build up an array of data points and values on the tunnel border of the while loop. Find the maximum, minimum, and mean value of the temperature data and display them in numeric indicators (the mean function can be found in Functions�Analyze�Mathematics�Probability and Statistics, and the Array Max & Min function can be found in Functions�Array) . Use the Write LabVIEW Measurements File Express VI, which can be found at Functions�Output. Once it is run, verify that the file was properly created by opening it in Notepad or by creating a VI that reads it back using the Read LabVIEW Measurements File. When you have completed the exercise, save your VI as Temperature Logger.vi.
Estimated completion time: 30-45 minutes.
Instructions:
Create a VI that acquires and displays temperature data at a fixed rate until stopped by the user. If you have completed Exercise 2 and have a DAQ card, use Thermometer.vi to obtain your data. If you have not completed the exercise or do not have a DAQ card, you can use the Digital Thermometer.vi from the Tutorial subpalette of the functions palette.
Once stopped, the VI should perform analysis on the data it collected while running. Build up an array of data points and values on the tunnel border of the while loop. Find the maximum, minimum, and mean value of the temperature data and display them in numeric indicators (the mean function can be found in Functions�Analyze�Mathematics�Probability and Statistics, and the Array Max & Min function can be found in Functions�Array) . Use the Write LabVIEW Measurements File Express VI, which can be found at Functions�Output. Once it is run, verify that the file was properly created by opening it in Notepad or by creating a VI that reads it back using the Read LabVIEW Measurements File. When you have completed the exercise, save your VI as Temperature Logger.vi.
55. Where Do I Go From Here? Example programs (Help� Find Examples�)
LabVIEW Student Edition (www.ni.com/labviewse)
Web resources (ni.com)
NI Developer Zone (zone.ni.com)
Application Notes
Info-labview newsgroup (www.info-labview.org/)
Instrument Driver Library (www.ni.com/idnet) Where do you go from here?
National Instruments offers a wide range of instructional courseware to expand your knowledge. Please visit ni.com/academic for programs and resources available.
The LabVIEW Student Edition is a available from our website. In includes Learning With LabVIEW, a textbook written by Dr. Bob Bishop from the University of Texas at Austin.
The web is the best place to turn in order to find information on LabVIEW. Ni.com is designed to be the one stop resource to find information.
The NI Developer Zone (�NIDZ�) is a place for developers to meet, discuss design issues, and post content.
Application Notes can be downloaded from ni.com/support on a variety of topics.
Info-labview is a newsgroup maintained by a third party.
There is an exhaustive library of LabVIEW instrument drivers available for download from NIDZ.
Where do you go from here?
National Instruments offers a wide range of instructional courseware to expand your knowledge. Please visit ni.com/academic for programs and resources available.
The LabVIEW Student Edition is a available from our website. In includes Learning With LabVIEW, a textbook written by Dr. Bob Bishop from the University of Texas at Austin.
The web is the best place to turn in order to find information on LabVIEW. Ni.com is designed to be the one stop resource to find information.
The NI Developer Zone (�NIDZ�) is a place for developers to meet, discuss design issues, and post content.
Application Notes can be downloaded from ni.com/support on a variety of topics.
Info-labview is a newsgroup maintained by a third party.
There is an exhaustive library of LabVIEW instrument drivers available for download from NIDZ.