Download
1 / 11
110 likes | 180 Views
Kaleidoscope Charter School. Elm Creek Watershed Management Commission Hennepin County Rush Creek Site #4 May 20, 2010 Spring 2010 Data Time tested: AM. In past 24 hours… Storm (heavy rain) Rain (steady) Showers (intermittent) Overcast Clear/Sunny Snowy. Now… Storm (heavy rain)

E N D
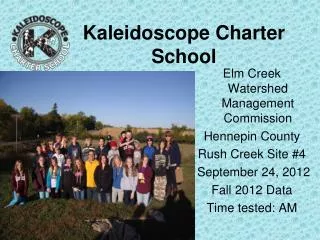
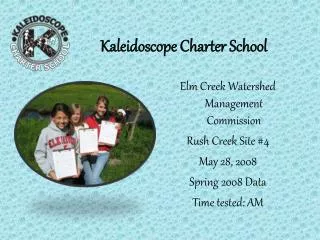
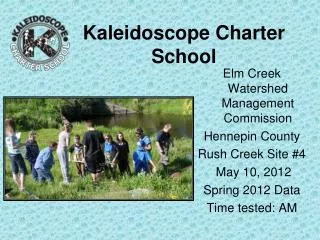
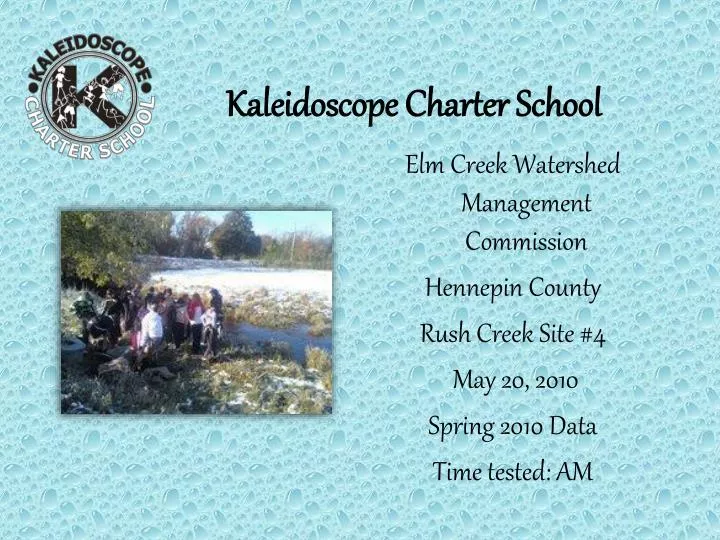
Kaleidoscope Charter School Elm Creek Watershed Management Commission Hennepin County Rush Creek Site #4 May 20, 2010 Spring 2010 Data Time tested: AM
In past 24 hours… Storm (heavy rain) Rain (steady) Showers (intermittent) Overcast Clear/Sunny Snowy Now… Storm (heavy rain) Rain (steady) Showers (intermittent) Overcast Clear/Sunny Weather Temperature ReadingsTaken in the shade Water Temperature:16CAir Temperature:20C
Water Appearance Water Odor Check one: • Clear • Blue-green • Green • Yellow • Brown • Milky • Check one: • None • Fishy • Musty • Rotten eggs • Septic
Residential Commercial Agriculture Natural/Preserve Lawns Wooded Crop land Grazing land Feed lot Paved roads or bridges Unpaved roads Construction Recreational use Industrial Land fill Waste treatment plant Evidence of past alteration Local Land Useland use in local watershed within ¼ mile of site
Check one: Rocky bottom Muddy bottom (Record the number of jabs taken in each habitat type) Vegetated bank margins 18 Snags and logs 13 Aquatic vegetation beds 19 Silt/Sand/Gravel substrate 28 Type of Sampling
Stream DepthMeasure the depth across the stream, from right bank to left bank in one-foot intervals for a minimum of 10 measurements
Measuring Stream Velocity Trial # • 12.09seconds 20 feet • 11.13seconds 20 feet • 14.28seconds 20 feet • 13.19seconds 20 feet • 11.50seconds 20 feet Average Time of Travel= Total Time divided by # of measurements 12.42 seconds Velocity= Distance divided by Average Time1.61 ft or meters/sec.
River Bottom Composition and Embeddedness Average Embeddedness Average Embeddedness for the site: TOTAL (add all 10 together) 380/10=38.0%
What the findings mean to the watershed The macro-invertebrates we found and identified have a medium to high tolerance level. We found 21 macro-invertebrates in the range of 0 to 4 tolerance level. We found 86 macro-invertebrates in the range of 6 to 10. This could mean the quality of water at the time of testing is close to neutral, however the low tolerance level of 0 and 3 in three of our samples indicate low levels of pollution in Rush Creek.