Download

1 / 37
390 likes | 493 Views
Macroeconomics ECO 110/1, AAU Lecture 10. Supply-Side Policy. Eva Hrom á dkov á , 26.4 2010. Overview. How does aggregate supply affect outcomes of the economy? The best of both worlds: low inflation & low unempl. How can we shift AS curve?.

E N D
Macroeconomics ECO 110/1, AAU Lecture 10 Supply-Side Policy Eva Hromádková, 26.4 2010
Overview • How does aggregate supply affect outcomes of the economy? • The best of both worlds: low inflation & low unempl. • How can we shift AS curve?
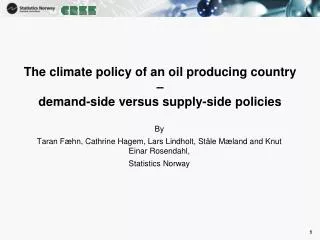
Aggregate SupplyMotivation for supply-side policies • In the 1970’s, the US economy has experienced stagflation = simultaneous occurrence of substantial unemployment and inflation. • Cannot be explained by changes in the aggregate demand (Q: why? – explanation = slide 8) • Alternative explanation was sought • What about other side of market = production? • Aggregate supply = total quantity of output that producers are willing and able to supply at alternative price levels in a given time period.
Aggregate SupplyShape of the AS curve • The response of producers to an AD shift is expressed in the slope and position of the AS curve. • If economy increases demand, will they produce more or charge higher prices? • There are three views concerning the shape of the aggregate supply curve. • Keynesian – very short term • Monetarist – very long term • Hybrid LO1
Aggregate SupplyKeynesian AS • AS is horizontal up to full employment. => Producers increase output, not prices, when AD expanded • At the full employment, AS becomes vertical. => At full capacity they cannot produce more, even if they are paid lot LO1
Aggregate Supply Monetarist AS • Producers make output decisions based on fundamental factors = technology, market size, capital • Change in price of output = change in costs of input (no change in output level) • AS is vertical and located at full employment. LO1
Aggregate Supply Hybrid AS • At low rates of unemployment AS is horizontal and at high rates of unemployment AS is nearly vertical. • In between, AS is gently upward sloping. • The closer to capacity, the greater the risk that fiscal or monetary stimulus will spill over into price inflation. LO1
Aggregate SupplyThe Inflation-Unemployment Tradeoff • Demand-side policies (fiscal and monetary) cannot reduce both unemployment and inflation at the same. • Demand stimulus: as the AS curve is upward-sloping, rightward shifts of the aggregate demand curve increase both prices and output. • Demand restraint: as the AS curve is upward-sloping, leftward shifts of the aggregate demand curve cause both prices and output to fall. LO2
Aggregate supply PRICE LEVEL INFLATION RATE REAL OUTPUT UNEMPLOYMENT RATE Aggregate SupplyThe Inflation-Unemployment Tradeoff - Illustration Increases in aggregate demand causes . . . . . A trade-off between unemployment and inflation. Phillips curve c C b B AD3 a A AD2 AD1 LO2
Aggregate SupplyThe Phillips Curve • ThePhillips curve= historical inverse relationship (tradeoff) between the rate of unemployment and the rate of inflation. • A. W. Phillips: UK, years 1826-1957 • Samuelson and Solow: USA, years 1900-1960 LO2
Aggregate SupplyThe Phillips curve - UK The Phillips curve in the UK, 1861 - 1913 LO2
Aggregate SupplyThe Phillips curve - USA The Phillips curve in the US, 1961 - 1969 LO2
Aggregate SupplyShifts of the AS curve • Many economists argue that the economy can attain lower levels of unemployment without higher inflation. • rightward shift of the AS curve can reduce unemployment and inflation at the same time • The Phillips curve shifts left, thus the unemployment-inflation trade-off eases • leftward AS shift creates stagflation(low output, rising prices) • Usually caused by supply-side shocks affecting both capital and labor force (hurricanes, tsunami) or expectations (September 11, 2001)
Price Level (average price per unit of output) 0 Output (real GDP per period) Aggregate SupplyRightward shift of the AS curve Rightward AS shifts reduce unemployment and inflation AS1 AS2 E1 E2 AD
Inflation Rate (percent) 1 2 3 4 5 6 7 8 Unemployment Rate (percent) Aggregate SupplyRightward shift of the AS curve – Shift of Phillips curve PC1 Rightward AS shifts cause leftward Phillips curve shifts PC2 a 4 b 2
Aggregate SupplyPolicy tools • Rightward shifts of the aggregate supply curve always generate desirable macro outcomes. • The AS curve can shift rightward through: • Tax incentives for saving, investment and work. • Human capital investment. • Deregulation. • Trade liberalization. • Infrastructure development. LO3
1 Cut tax rates to put more disposable income in people’s hands. 1 Cut tax rates to boost incentives to work and invest. 2 Firms invest more and try new ventures; jobs are created; people work harder aggregate supply increases. 2 People use increased income to buy more goods and services: aggregate demand increases. 3 New investment and labor bring increased output. 3 To meet new demand, companies expand output. 4 Employment rises, new plants go up, the whole economy expands. Two Theories for Getting the Economy Moving Supply-Side Theory Keynesian Theory LO3
Supply-Side Policies1. Tax Incentives • Keynesians: tax cuts are used to increase aggregate demand through increase in disposable income. • Supply-side economy: analyses direct effects of taxes on the incentives to work and produce LO3
Supply-Side Policies1. Tax Incentives • Supply-side theory places special emphasis on marginal tax rates = the tax rate imposed on the last (marginal) dollar of income. • Progressive tax: higher income => higher relative tax payment => increasing marginal tax rate • Flat tax: constant marginal tax rate LO3
1. Tax IncentivesEffects Labor supply: • The marginal tax rate influences the financial incentive to increase one’s work. • If the marginal tax rate is high, there is less incentive to work. Entrepreneurship: • High progressive tax rates discourage entry into self-employment. Investment: • Aggregate supply will be constrained if high tax rates discourage investment. LO3
1. Tax IncentivesComputational Problem #1: Suppose taxpayers are required to pay a base tax $50 plus 50% on any income over $200. Suppose further that the taxing authority wishes to decrease by $30 the taxes of people with incomes of $300. • If the marginal tax rates are to remain unchanged, what will the new tax base be? • If the base tax of $50 is to remain unchanged, what will marginal tax rate have to be? • What are the implications of these tax changes in the view of Keynesian theory? • What are the implications of these tax changes in the view of supply-side theory?
1. Tax IncentivesTax-Induced Supply Shifts • A reduction in marginal tax rates shifts the aggregate supply curve to the right. • Work effort, entrepreneurship, and investment increase. • Note: Tax rebates or lump sum deductions do not shift AS because they are one-time windfall and have no effect on marginal tax rates. LO3
1. Tax IncentivesQuantification of effect: The Tax Elasticity of Supply • Thetax elasticity of supplyis the percentage change in quantity supplied divided by the percentage change in tax rates. • If the tax elasticity of supply were large enough (larger than 1), a tax cut might actually increase tax revenues. • Estimates of tax elasticity of supply: 0.15-0.2 LO3
1. Tax IncentivesComputational Problem #2: Suppose households supply 150 billions hours of labor per year and have a tax elasticity of supply of 0.25. If the tax rate is increased by 5%, by how many hours will the supply of labor decline?
1. Tax IncentivesSavings and Investments Incentives • Supply-side economists favor tax incentives that encourage saving as well as greater tax incentives for investment. • Demand side – stimulate consumption not saving (due to multiplication effect) • Savings = source for investment and growth • Policies that encourage investment: cutting capital gains tax rates and investment tax credits LO3
2. Human Capital Investment • Human capitalis the knowledge and skills possessed by the work force. • If the quality of work force increases, more output can be supplied at given price level • Structural unemployment – mismatch between skills and jobs requirements – major cause of unemployment – inflation trade-off • Firms cannot hire more workers – they raise prices • Thus, policies focused on decreasing structural unemployment shift AS curve to the right LO3
2. Human Capital InvestmentA. Worker Training • Tax incentives to businesses that offer worker training is a viable policy tool for future shift in aggregate supply. • In the long run they increase labor productivity = the amount of output produced by a worker in a given period of time. • Measured as output per hour (or day, etc.). • In the short run they impose additional labor costs LO3
2. Human Capital InvestmentB. Education Spending Expansion and improvement of the efficiency of the educational system => higher HC Examples: • School vouchers • Q: Do you like the idea? Where do you see its strengths / weaknesses? • Increased gvt. spending on schools • Tax incentives for college savings accounts • Note: Education spending is more likely to develop human capital gradually rather than to spur short-term economic growth. LO3
2. Human Capital InvestmentC. Reducing discriminatory barriers • Race and gender issues (as opposed to lack of skills and experience) can create artificial barriers between job seekers and job openings. Policies: • Affirmative action (positive discrimination) • Q: Yes/no? What is your opinion? LO3
2. Human Capital Investment D. Transfer Payments • Transfer payments are payments to individuals for which no current goods or services are exchanged, such as social security, welfare, unemployment benefits. • On one hand side, they serve important social needs. • On the other, they can discourage workers from taking jobs. LO3
3. DeregulationA. Factor markets • The added costs of production due to regulation shift the aggregate supply curve to the left. • Minimum wage: • Main goal: ensure a decent standard of living (CR 8000 CZK) • By-product: limits ability of employers to hire additional people • Mandatory benefits • Health benefits, leaves of absence • Occupational health and safety • minimum safety conditions at workplaces LO3
3. DeregulationB. Product markets • Transportation costs: • E.g.: Regulation of truck traffic during weekends • Food and drug standards • Goal = minimize health risks to consumers • Approval of new drugs – long time and huge investment • Fewer new drugs are brought to market • They are more expensive • Efficiency x harmfulness (drug neither helps nor harms) LO3
3. DeregulationSummary • The basic contention of supply-side economists is that the regulatory costs are now too high. • They favor deregulating the production process in order to shift aggregate supply to the right. • Other opinion: regulation = price of externality LO3
4. Easing Trade BarriersA. Factor and product markets • Government regulation of international trade affects aggregate supply. • Factor markets: Tariffs, quotas and restrictions that make foreign inputs more expensive constrain domestic AS • Product markets: Tariffs, quotas and restrictions that make foreign products more expensive constrain domestic AS Policies: WTO, NAFTA, EU – common market • Q1: What is the difference between tariff and quota? • Q2: Why do countries introduce these protectionist measures? LO3
4. Easing Trade BarriersB. Immigration • Immigration of foreign-born workers can increase the pool of skilled labor, shifting the aggregate supply curve to the right. • Solution to low population growth? Policies: green card initiatives (Canada, Australia, but also CR) Dangers: • Brain drain • Second and third generation LO3
5.Infrastructure Development • Improving the nation’s infrastructure reduces the costs of supplying goods. • Infrastructureis the transportation, communications, education, judicial, and other institutional systems that facilitate market exchanges. • Q1: Would you say your country has an adequate infrastructure? What is the main problem? LO3