Download
1 / 22
220 likes | 222 Views
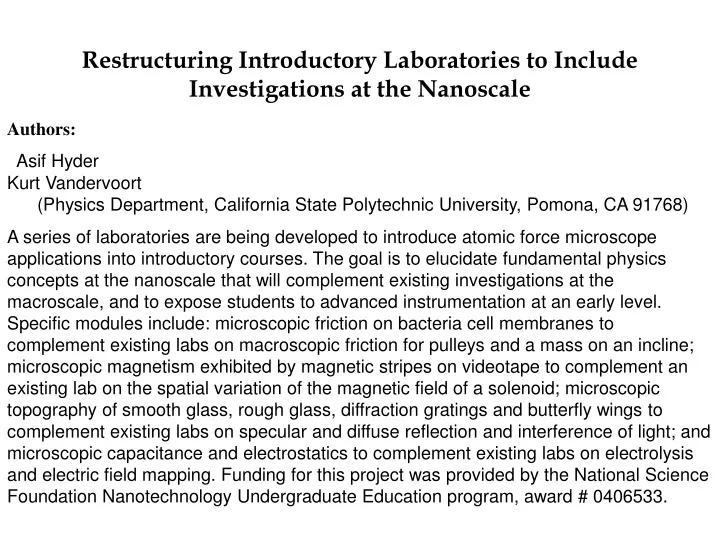
Restructuring Introductory Laboratories to Include Investigations at the Nanoscale. Authors: Asif Hyder Kurt Vandervoort (Physics Department, California State Polytechnic University, Pomona, CA 91768)

E N D
Restructuring Introductory Laboratories to Include Investigations at the Nanoscale Authors: Asif HyderKurt Vandervoort (Physics Department, California State Polytechnic University, Pomona, CA 91768) A series of laboratories are being developed to introduce atomic force microscope applications into introductory courses. The goal is to elucidate fundamental physics concepts at the nanoscale that will complement existing investigations at the macroscale, and to expose students to advanced instrumentation at an early level. Specific modules include: microscopic friction on bacteria cell membranes to complement existing labs on macroscopic friction for pulleys and a mass on an incline; microscopic magnetism exhibited by magnetic stripes on videotape to complement an existing lab on the spatial variation of the magnetic field of a solenoid; microscopic topography of smooth glass, rough glass, diffraction gratings and butterfly wings to complement existing labs on specular and diffuse reflection and interference of light; and microscopic capacitance and electrostatics to complement existing labs on electrolysis and electric field mapping. Funding for this project was provided by the National Science Foundation Nanotechnology Undergraduate Education program, award # 0406533.
Atomic Force Microscope
How does the AFM work? Laser light reflected off a cantilever is monitored so that the cantilever flexure (and tip-sample force) is maintained constant. To maintain this constant force (and tip-sample separation), a feedback circuit raises or lowers the tip over sample features. Tip height is recorded as a function of horizontal position to yield the surface topography. Specialized modes of operation allow measurements of electric, magnetic and frictional forces.
Laser Detection Laser Emission Cantilever Path of Tip Tip Surface Sample PZT AFM Operation
Existing Lab Objectives • Observe the basis for wave theory of light • Study diffraction/interference with single and multiple slits • Modifications • Students will measure the diffraction pattern from a CD and calculate the groove separation. • Students will use the AFM to measure CD groove separation directly. • Students will use the AFM to measure the height of the bumps on the CD surface, making comparisons to the wavelength of light. • Learning Enhancements • Connect physical concepts to an application familiar to the students. • Demonstrate advantage of microscopic measurement by revealing features not measurable in diffraction pattern. • Demonstrate the importance of the bump height for destructive or constructive interference, revealing a second application of the interference of light.
Image from CD with peak heights visible Add textbox 3D AFM Image of CD, showing bumps and flat areas for digital data storage. Bump height is 1/4 wavelength of light.
Results 1.) Bumps measured with AFM show horizontal separation of Recordable CD: 1.59 ± .005 µm Non-recordable CD: 1.75 ± .005 µm 2.) Bump height is 125 ± 3 nm This implies a laser wavelength of 500 ± 12 nm in the coating. The coating has an index of refraction of 1.55. Therefore, the wavelength in air of the laser should be 794 ± 19 nm, which is infrared light. This value is within our experimental error of an actual CD laser wavelength, 780 nm. The percent difference is 1.8 %.
Existing Lab Objectives • Observe atomic spectra through a diffraction grating to identify unknown samples. • Modifications • Students will use the AFM to measure the slit separation of the diffraction grating. • Students will use the AFM to determine the blaze angle of the diffraction grating. • Learning Enhancements • Students confirm the slit separation for their grating directly, rather than simply trusting the numbers in the lab manual. • Students encounter the concept of blaze angles, revealing important manufacturing and application considerations for diffraction gratings.
Multiple slit interference pattern has maxima at d sin m = m m d Single slit diffraction envelope has maximum intensity at q = 0. A{
qB = Blaze angle By blazing the grating, one can shift the single slit diffraction central maximum to a higher order maximum (m>1) of the interference pattern. This will increase the intensity of the higher order interference peak. qB qB qB Single slit central maximum (follows refracted ray). Multiple slit interference maximum (follows dsinqm = ml equation). d Blaze condition: sin-1(nsinqB) – qB = qm qm m=0 m=1
Results 1.) Diffraction grating shows a slit separation of 1.55 ± 0.1 µm; This differs from manufacturers specifications of 1.67 µm by 7.2%. 2.) The blazing angle is determined to be 22° ± 1 This would set the maximum intensity for E-M waves with wavelength of 439 ± 40 nm, Which is indigo in the visible spectrum from our calculations.
Existing Objectives • Students do several experiments in geometrical optics that include ray tracing diagrams to investigate: • the law of reflection • the law of refraction • critical angles • the thin lens equation • Modifications • Students will visually examine the surface of a gold plated glass slide to verify that it is mirror like (specularly reflective). • Students will use the AFM to measure the roughness (rms height variation and width of surface features) of the gold coated glass slide. • Learning Enhancements • Students will be able to directly confirm criteria that define the limit for geometrical optics. Namely, that the surface roughness is significantly less than the wavelength of light.
Results Dominant surface features are bumps elongated along scanning direction. Measured dimensions are: width: 30 nm length: 200 nm height: 10 nm These values are all significantly smaller than the wavelengths of visible light.
Future Work • Optics Labs • Examine biological samples (butterfly wings) with the AFM to show other applications in nature involving the interference of light. • Magnetic Force Labs • Electric Force Labs • Frictional Force Labs