Download
1 / 13
130 likes | 136 Views
FM13p.21 – Solar Diameter Measurements from Eclipses as a Solar Variability Proxy. David W. Dunham*, Internat’l Occultation Timing Assoc. (IOTA); Sabatino Sofia, Yale Univ. – retired; Konrad Guhl, IOTA/European Section; and David Herald, IOTA

E N D
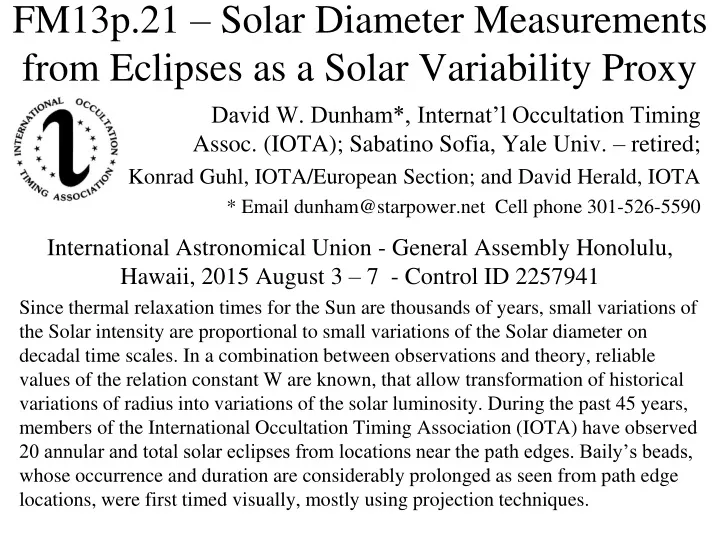
FM13p.21 – Solar Diameter Measurements from Eclipses as a Solar Variability Proxy David W. Dunham*, Internat’l Occultation Timing Assoc. (IOTA); Sabatino Sofia, Yale Univ. – retired; Konrad Guhl, IOTA/European Section; and David Herald, IOTA * Email dunham@starpower.net Cell phone 301-526-5590 International Astronomical Union - General Assembly Honolulu, Hawaii, 2015 August 3 – 7 - Control ID 2257941 Since thermal relaxation times for the Sun are thousands of years, small variations of the Solar intensity are proportional to small variations of the Solar diameter on decadal time scales. In a combination between observations and theory, reliable values of the relation constant W are known, that allow transformation of historical variations of radius into variations of the solar luminosity. During the past 45 years, members of the International Occultation Timing Association (IOTA) have observed 20 annular and total solar eclipses from locations near the path edges. Baily’s beads, whose occurrence and duration are considerably prolonged as seen from path edge locations, were first timed visually, mostly using projection techniques.
Abstract - continued Since about 1980, they have been timed mainly from analysis of video recordings. The edge locations have the advantage that most of the beads are defined by the same features in the lunar polar regions that cause the phenomena at each eclipse. Some of the best-observed mo- dern eclipses can be used to assess the accuracy of the results, which are limited mainly by the intensity drop at the Sun’s edge, and the con- sequent uncertainty in defining the edge. In addition, direct visual con- tact timings made near the path edges during earlier eclipses, back to 1715, have been found in the literature, and analyzed. Although the ob- servations seem to show small variations, they are only a little larger than the assessed accuracies. The results can be improved with a con- sistent re-analysis of the observations using the much more accurate lunar profile data that is now available from the Japanese Kaguya and NASA’s LRO lunar orbiter observations. Also, IOTA has plans to observe future eclip- ses with a variety of techniques that were used in the past, to better assess the accuracies of the different observational methods that have been used, and determine any systematic differences between them.
Overview • IOTA’s long term solar radius measurement research • Observations near central eclipse path edges since 1970 • Analysis of historical obs. back to 1715; look for more • Re-analyze all obs. with accurate profile data- eg, LRO • These large tasks manageable with some help from others in and outside of IOTA
Central Solar Eclipses from near the Path Edges, the Ultimate “Grazing Occultation” • Interest in solar eclipses increased in the early 1980’s when comparison of observations of the February 26, 1979 eclipse, well-observed in North America, showed that the solar radius was about 0.4 smaller then than during eclipses observed in 1715 (Dunham et al., Science, 210, pp. 1243-1243, 1980) and in 1925 (Sofia et al., Nature, 304, pp. 522-526, 1983). • Timings of the eclipse duration (2nd and 3rd contacts), and of other Baily’s bead phenomena near the limits of total and annular eclipses, were found to give the best accuracy – see the next panel. • Members of the International Occultation Timing Association (IOTA) and others began traveling to the edges of eclipse paths to time Baily’s bead phenomena, first visually by viewing a projected image of the Sun but since 1983 mostly by video recording the eclipse to obtain a more complete record of the phenomena. • Solar radius values determined from observations of nine eclipses were published in 1994 (Fiala, Dunham, and Sofia, Solar Physics, 152, pp. 97-104). • Since the edge of the Sun is not perfectly sharp but has a steep gradient, and different filters have been used in the observations, the consistency and accuracy of the results have been found to be poorer than the early estimates.
Video Recording of Baily’s Beads, Curaçao, Feb. 26, 1998 • Richard Nugent; recorded using a 4-inch Meade ETX and Thousand Oaks solar filter. • 18:13:56 UT • 18:14:00 UT • 18:14:10 UT • 18:14:12 UT • 18:14:18 UT
Analyzing the Video Recordsnearly all reduced with Watts profile data • The digital tape clock times were calibrated with UTC using time signals or GPS time stamps. • A video time inserter that triggers from WWV minute tones, designed and built by Peter Manly, with results improved with a VTACT unit designed and built by Tom Campbell, Jr., was used to insert UTC displays on VHS video tapes. • The tapes were then advanced slowly a frame at a time to establish the UTC of the recorded Baily Bead phenomena to an accuracy of about 0.1 second. • Using the Baily’s Bead module of the WinOccult program by D. Herald, downloaded from the main IOTA Web site at http://www.lunar-occultations.com/iota, the lunar feature (angle measured from the projection of the Moon’s axis of rotation, called “Watts angle” or WA) was identified for each timing using the program’s profile display (example below). The display is calculated for the time of the observed bead event. • The height of the Sun’s limb (the diagonal line below) above the lunar mean limb (the horizontal dashed line) at the bottom of the lunar valley (for D and R events), and the height of the Moon’s limb at that angle, were entered into a spread sheet (see next panel) that calculated their difference (residual). • Solrad, Dunham’s DOS FORTRAN program, was used to calculate corrections to the Moon’s center relative to that of the Sun, and the solar radius, using the residuals from many of the bead events.
Solar Radius Determinations from Solar Eclipses The radius correction, delta-R, is relative to the standard value at 1 A.U., 959.63 arc seconds. All have been reduced using David Herald’s WinOccult program and analyzed with the Solrad programs.The Delta-R values are from 2-parameter solutions using bead events within 30° of the poles to use the better accuracy of the lunar polar profile as explained in a previous slide. 7
Solar Radius Determinations from Solar Eclipses Compared with SDS and SOHO Data • The eclipse points with their formal solution error bars are plotted below. • Four red dots are from the Solar Disk Sextant, from Sabatino Sofia. • The gray curve is the “statistical thermal model correction” SOHO data from Fig. 13 of Kuhn, Bush, Emilio, and Scherrer, Ap. J.,613, p. 1249, 2004. Their “a priori thermal model correction” is about 0.2 below the statistical thermal model data. SOHO was not designed to measure the solar radius; the application of large thermal effect corrections may have systematic errors.
Accuracy of the Video Observations of the Total Solar Eclipse of February 26, 1998 The radius determinations were calculated in two stages, first a solution solving for corrections to the ecliptic longitude and latitude of the Moon’s center relative to the Sun’s center, and the solar radius. The longitude correction from this first solution was then fixed in a second solution that used only bead events within 30° of the poles and found corrections only to the latitude and radius. There were two video recordings made at each limit (N1, N2 and S1, S2) with observer’s initials in the table followed by the number of bead timings. The first line in the two tables includes all observers; the results for different combinations of single observers at each limit follow. The first line of the 2nd (2-parameter) table was used in the table in panel 9. Although the formal error for each result is rather small, the differences between results for different combinations of observers show that the true error is larger, about 0.15, apparently reflecting different levels of the Sun detected by different scope/filter/camera combinations. A similar analysis of the 1878 eclipse showed larger errors for visual observations.
1715 eclipse, northern limit, Darrington, EnglandP. Muller’s position doesn’t match location description New analysis uses the location based on the location description.
Recording the flash spectrum in a series of images at the contacts promises good results, enabling measurement of the solar edge intensity profile in different wavelengths. But comparison with the older direct obs. is important for use of historical eclipses.
Summary of Remaining Work • Search publications and local university archives for past observations to analyze • Work remains to be done, for example, on the rather well-observed US eclipses of 1806 and 1869 • The Internet facilitates connection with local historians who can often find information about past observations. • Google Earth and other GIS tools make position determination much easier than using topo maps • Re-analyze all obs. with accurate profile data- eg, LRO • New observations with previous and modern techniques, especially at the 2017 eclipse, are needed to calibrate the earlier observations • Anyone near a university or a central eclipse path, or even with just internet access, can help
RASC Observer’s Handbook and http://www.occultations.org A video of the1994 May annular eclipse video by Ken Wilcox can be seen on YouTube at https://www.youtube.com/watch?v=JIcQ0z_xQlo This and many other eclipse and occultation YouTube videos are linked to from: http://www.asteroidoccultation.com/observations/YouTubeVideos.htmListed on this web page are, in groups from top to bottom, Lunar Occultation Videos; Asteroidal Occultation Videos; Jupiter/Saturn Satellite Events Miscellaneous Events (most of them are solar eclipse videos made near the edges of total and annular solar eclipse paths)