Download
1 / 15
150 likes | 190 Views
Discover how duplicating frequently used paths can enhance analysis efficiency in data flow. Learn about identifying and duplicating "hot paths" through a novel approach of Path Profiles. See how the process improves precision in data flow analysis and boosts performance.

E N D
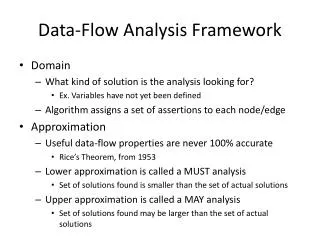
Improving Data-flow Analysis with Path Profiles • Glenn Ammons & James R. Larus • University of Wisconsin-Madison • 1998 • Presented by Jessica Friis
Problem and Approach • Some paths in a CFG are not run • A small number of paths often make up a large portion of the runtime • By duplicating some frequently used paths, we can improve analysis on them
Outline • Identify “hot paths,” frequently run paths in a CFG by doing a training run on the program • Duplicate “hot paths” to form a new CFG, the Hot Paths Graph, or HPG • The extra paths allow more precise analysis. Constant propagation is looked at here • Reduce the graph to preserve only the valuable solutions for the rest of compilation. • Implementation and Results
Example CFG Hot paths taken during sample executions • A, B, C, E, F, H, I, X • A, B, D, E, F, H • B, D, E, G, H • B, D, E, F, H, I, X Use Ball-Larus path profiles Chose paths so that they cover 97% of execution time
Finite Automaton for the path profile • The retrieval tree is used as a simple representation of the automaton. • CFG edges label the transitions • At 13, 15, or 16, a B takes you back to 0 • Anything else not labeled goes to an error state • These extra states/edges are left out for readability
Trace CFG and FA to get HPG • Uses Holley and Rosen's data flow tracing algorithm • The HPG will have nodes made up of a tuple {v,q} where v is a vertex from the original CFG and q is a state in the automaton • A worklist algorithm starts with {r,qƐ} where r is the starting node in the CFG and qƐ is the starting node in the automaton. It follows the edges in the CFG and automaton to create a new HPG
The diagonally striped nodes (A0 and B0) represent the beginnings of the forward paths The shaded nodes represent the error states in the automaton (paths that are not 'hot.') Haven't lost any information from orginal CFG New HPG
New Knowledge with HPG • At H14, a+b=6 • At H12, H15, a+b=5 • At H13, a+b=4 • At H14&H15, i++ = 1 • At I17, n is 1 These are new constant results
Eliminate unneeded vertices • Heuristic algorithm for identifying the most valuable duplicated vertices. • Others can be reduced/combined to form rHPG for further compilation.
Implementation • Implemented as two new paths in SUIF compiler, PP and PW • Compile into intermediate form • PP pass instrumented intermediate form for path profiling • Running the result gives us our path profile • Next the intermediate code and the path profile is run through PW • PW generates the HPG, discovers new constants, and generates the rHPG • The output is compiled into an executable
Speedup of SPEC95 benchmarks • The benchmarks with the most new constants found sped up, the other slowed • The increase in program size causes the slowdown
Program Costs • Cost of duplication in size of CFG → HPG • Go increased 184% • All others increasaed an average of 32% • Cost of duplication in size of CFG → rHPG • Go increased 77% • All others increased less than 10% • Analysis time • Go took 6 times longer • All others took an average of 61% longer
Contributions • Shows improvements in the precision of data flow analysis through guided duplication • Describes how to reduce hot path graphs • Preserves path profiling information through transformation from CFG to HPG to rHPG • Applies to constant propagation to show performance increase
Issues • The cost of analysis is significant • Only should be used just before release • The increased graph size slows down the running time • Specific reasons are not known, but larger program size is a possibility • They only tested with a single optimization • Adding in other optimizations may give more speedup gains