Download
1 / 25
250 likes | 258 Views
EMISSION SPECTROSCOPIC STUDIES OF LASER-INDUCED GRAPHITE PLASMAS László Nemes Research Laboratory for Materials and Environmental Chemistry, Chemical Research Center, Hungarian Academy of Sciences, Pusztaszeri út 59-67, Budapest, Hungary e-mail address: nemesl@chemres.hu.

E N D
EMISSION SPECTROSCOPIC STUDIES OF LASER-INDUCED GRAPHITE PLASMAS László Nemes Research Laboratory for Materials and Environmental Chemistry, Chemical Research Center, Hungarian Academy of Sciences, Pusztaszeri út 59-67, Budapest, Hungarye-mail address: nemesl@chemres.hu
EXPERIMENTAL A home-built TEA CO2 laser and a miniature YAG laser were used for plasma generation from spectroscopically pure graphite targets. The CO2 laser provided 2 microsec long individual pulses at energies around 15- 20 J, while the YAG laser pulses at 1064 nm had energy around 30 mJ and duration 10 ns. The YAG laser could be operated with pulse sequences (separation about 10 microsec). The focussed laser power was around 0.5-2 GW/cm2 and 200 MW/cm2 for the CO2 and YAG lasers, resp. Single pulse spectral events were captured by OceanOptics PC1000 and PC2000 fiber-optic spectrometers for which home-made trigger units provided synchronization with the lasers. Spectral accumulation was started before the laser pulses, all LIBS spectra shown were taken with time integration for durations 8 and 50 ms, for the PC1000 and PC2000, resp. Spectral resolution for the PC2000 spectrometer was 1.5 nm. Relative irradiance spectra were obtained using a calibrated spectral lamp
SHORT SUMMARY •Pulsed CO2 and YAG lasers were used to create plasma breakdown spectra (LIBS) from a room temperature graphite target in the range 350-900 nm with a resolution of 15 A. Emission was captured from single pulses by a small, fiber-optic CCD spectrometer in a time-integrated fashion. Spectra were taken in vacuo, and in helium and carbon dioxide atmospheres. •LIBS spectra are dominated by the Swan bands of C2 as well as atomic lines due to neutral and ionised C and He. In addition a broad continuum due partially to small carbon particles is observed. The LIBS show dependence on the position of observation. •Plasma temperature was inferred by spectral simulation of the Swan bands and was found in the range 5200-10000 K. •At the expected location of the cometary band of C3 (near 403 nm) overlapping (atomic) features were observed. Some considerations on the observability of this band in laser plasmas are given.
Effect of ablated particles from C60 on the background continuum
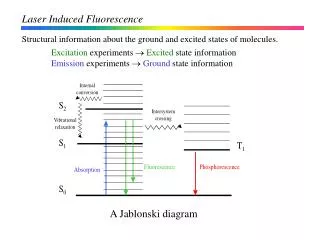
On the observability of the 403 nm C3 band in LIBS • In high temperature carbon vapour sources the band is clearly seen using LIF (ref.1). • In laser-induced carbon LIBS, using a room temp. graphite target and a pulsed YAG laser the band is observed as a broad continuum (ref.2). • In carbon nanotube growing by laser ablation using a hot graphite furnace the same broad continuum is observed with one or two YAG lasers applied (ref.3). • ref.1.: D.M. Mann, J. Appl.Phys. 49 (1978) 3485-3489 • ref.2.: P. Monchicourt, Phys. Rev. Lett., 66 (1991) 1430-1433 • ref. 3.: S. Arepalli, C.D. Scott: Chem.Phys. Lett., 302 (1999) 139-145
CONCLUSIONS • LIB spectra from room temperature graphite targets in vacuum, He and CO2 gases are characterized by C2 Swan bands, and atomic lines from C and He. • The background continuum underlying the Swan bands is at least partially due to small carbon particles. • LIB spectra are sensitive to the location of observation, atomic lines appear closer to the target. • The temperature obtained by spectral fitting to C2 Swan transitions is between 5000 and 10000 K, closer to the target the temperature is significantly higher. • Plasmas obtained by a TEA CO2 laser (vs. YAG) contain highly ionised carbon and stronger continuum background. • In time integrated spectra, due to the presence of atomic lines near 400 nm, the cometary C3 band could not be identified
Developments under way • EXPERIMENTAL: • Use of a Quantel Brilliant YAG laser at 1064, 532 and 355 nm. • Use of a new miniature CCD spectrometer with 3 A resolution in the 350-650 nm range and NIST traceable intensity. • Determination of plasma lifetimes by a fast Si detector. • Construction of a laser-oven for hot graphite targets. • THEORETICAL: • Development of a plasma kinetic / chemical kinetic model for electron, atomic and molecular kinetics in LIBS spectra, with special emphasis for C2 and C3
ACKNOWLEDGEMENT Support for the present work was provided by the Hungarian Research Fund (OTKA) under contract number # T032549, travel funds from the Hungarian Ministry of Education were applied for. We also acknowledge the help provided by Dr. James O. Hornkohl, University of Tennessee Space Institute, U.S.A., in Swan band spectral simulations for for temperature determination.